


Statistics 12-25
8312STAT.DOC TI-83 international English Bob Fedorisko Revised: 02/19/01 12:42 PM Printed: 02/19/01 1:37
PM Page 25 of 38
1
.
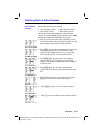
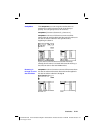
Var Stats (one-variable statistics) analyzes data with one
measured variable. Each element in
freqlist
is the
frequency of occurrence for each corresponding data point
in
Xlistname
.
freqlist
elements must be real numbers > 0.
1
.
Var Stats [
Xlistname
,
freqlist
]
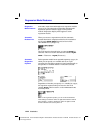
2
.
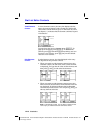
Var Stats (two-variable statistics) analyzes paired data.
Xlistname
is the independent variable.
Ylistname
is the
dependent variable. Each element in
freqlist
is the
frequency of occurrence for each data pair
(
Xlistname,Ylistname
).
2
.
Var Stats [
Xlistname
,
Ylistname
,
freqlist
]
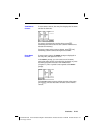
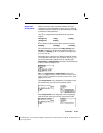
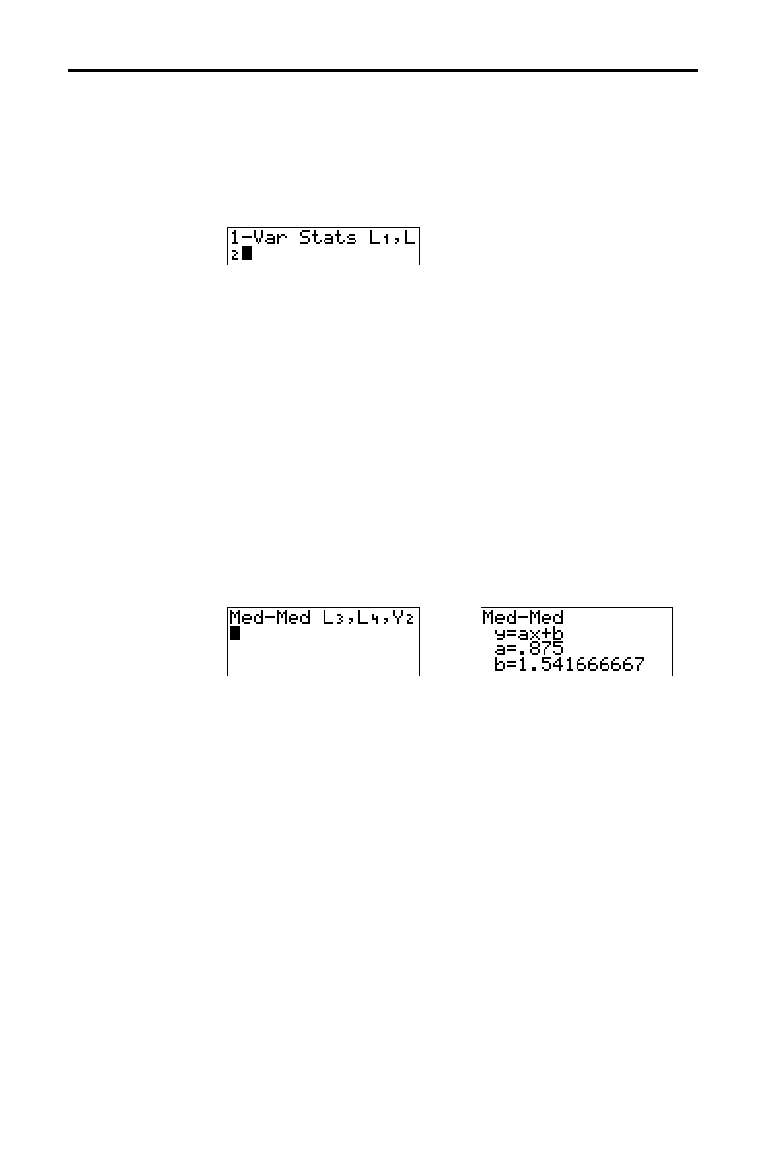
Med
.
Med (median-median) fits the model equation y=ax+b
to the data using the median-median line (resistant line)
technique, calculating the summary points
x
1
, y
1
, x
2
, y
2
, x
3
,
and
y
3
. Med
.
Med displays values for a (slope) and
b (y-intercept).
Med
.
Med [
Xlistname
,
Ylistname
,
freqlist
,
regequ
]
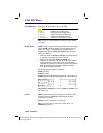
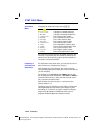
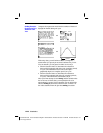
LinReg(ax+b) (linear regression) fits the model equation
y=ax+b to the data using a least-squares fit. It displays values
for
a (slope) and b (y-intercept); when DiagnosticOn is set, it
also displays values for
r
2
and r.
LinReg(ax+b) [
Xlistname
,
Ylistname
,
freqlist
,
regequ
]
QuadReg (quadratic regression) fits the second-degree
polynomial y=ax
2
+bx+c to the data. It displays values for a,
b, and c; when DiagnosticOn is set, it also displays a value
for
R
2
. For three data points, the equation is a polynomial
fit; for four or more, it is a polynomial regression. At least
three data points are required.
QuadReg [
Xlistname
,
Ylistname
,
freqlist
,
regequ
]
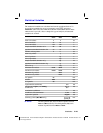
1-Var Stats
2-Var Stats
Med-Med
(ax+b)
LinReg
(ax+b)
QuadReg
(ax
2
+bx+c)