


Statistics 12-31
8312STAT.DOC TI-83 international English Bob Fedorisko Revised: 02/19/01 12:42 PM Printed: 02/19/01 1:37
PM Page 31 of 38
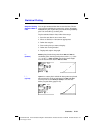
You can plot statistical data that is stored in lists. The six
types of plots available are scatter plot, xyLine, histogram,
modified box plot, regular box plot, and normal probability
plot. You can define up to three plots.
To plot statistical data in lists, follow these steps.
1. Store the stat data in one or more lists.
2. Select or deselect
Y=
functions as appropriate.
3. Define the stat plot.
4. Turn on the plots you want to display.
5. Define the viewing window.
6. Display and explore the graph.
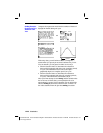
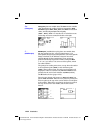
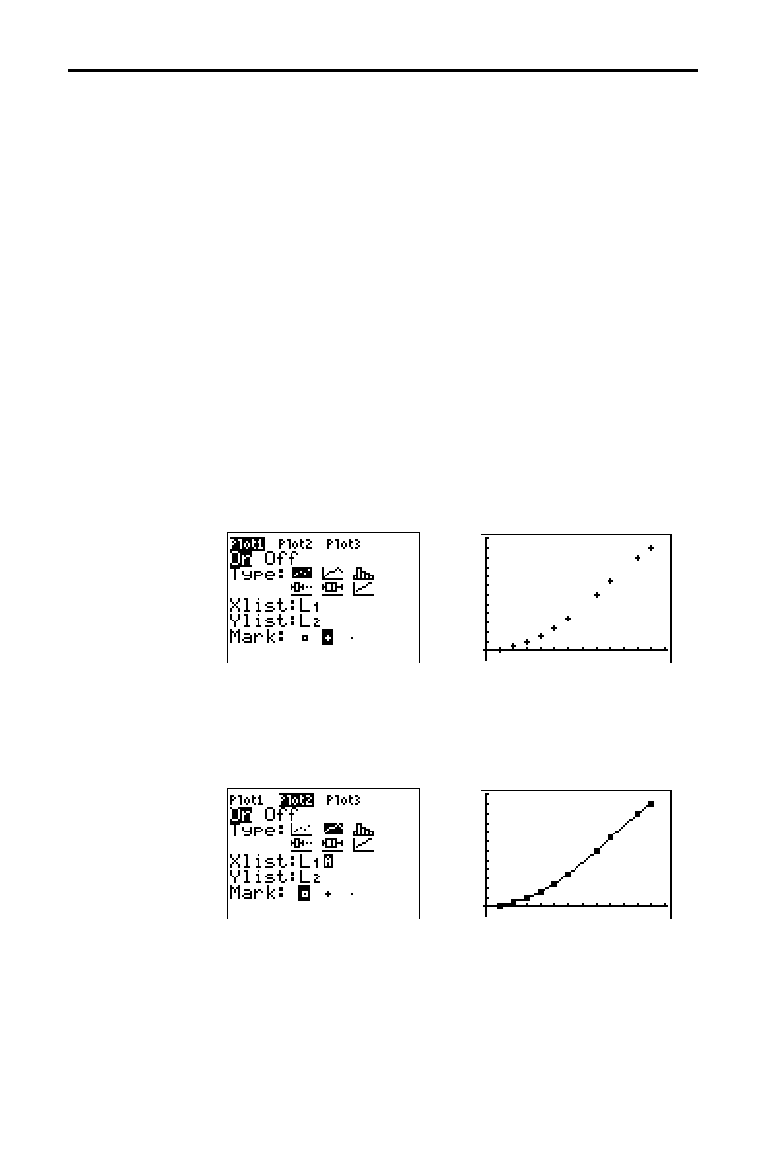
Scatter plots plot the data points from Xlist and Ylist as
coordinate pairs, showing each point as a box (
›
), cross
(
+ ), or dot (
¦
). Xlist and Ylist must be the same length.
You can use the same list for
Xlist and Ylist.
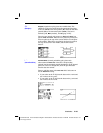
xyLine is a scatter plot in which the data points are plotted
and connected in order of appearance in
Xlist and Ylist.
You may want to use
SortA( or SortD( to sort the lists
before you plot them (page 12
.
20).
Statistical Plotting
Steps for Plotting
Statistical Data in
Lists
"
(Scatter)
Ó
(xyLine)