


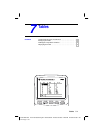
Sequence Graphing 6-13
8306SEQN.DOC TI-83 international English Bob Fedorisko Revised: 02/19/01 12:22 PM Printed: 02/19/01 1:36
PM Page 13 of 16
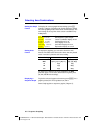
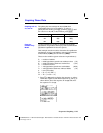
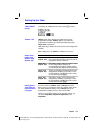
The phase-plot axes settings uv, vw, and uw show
relationships between two sequences. To select a
phase-plot axes setting, press
y
[
FORMAT
], press
~
until
the cursor is on
uv, vw, or uw, and then press
Í
.
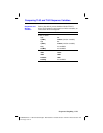
Axes Setting x-axis y-axis
uv u(
n
)v(
n
)
vw v(
n
)w(
n
)
uw u(
n
)w(
n
)
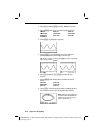
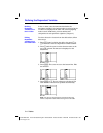
Use the predator-prey model to determine the regional
populations of a predator and its prey that would maintain
population equilibrium for the two species.
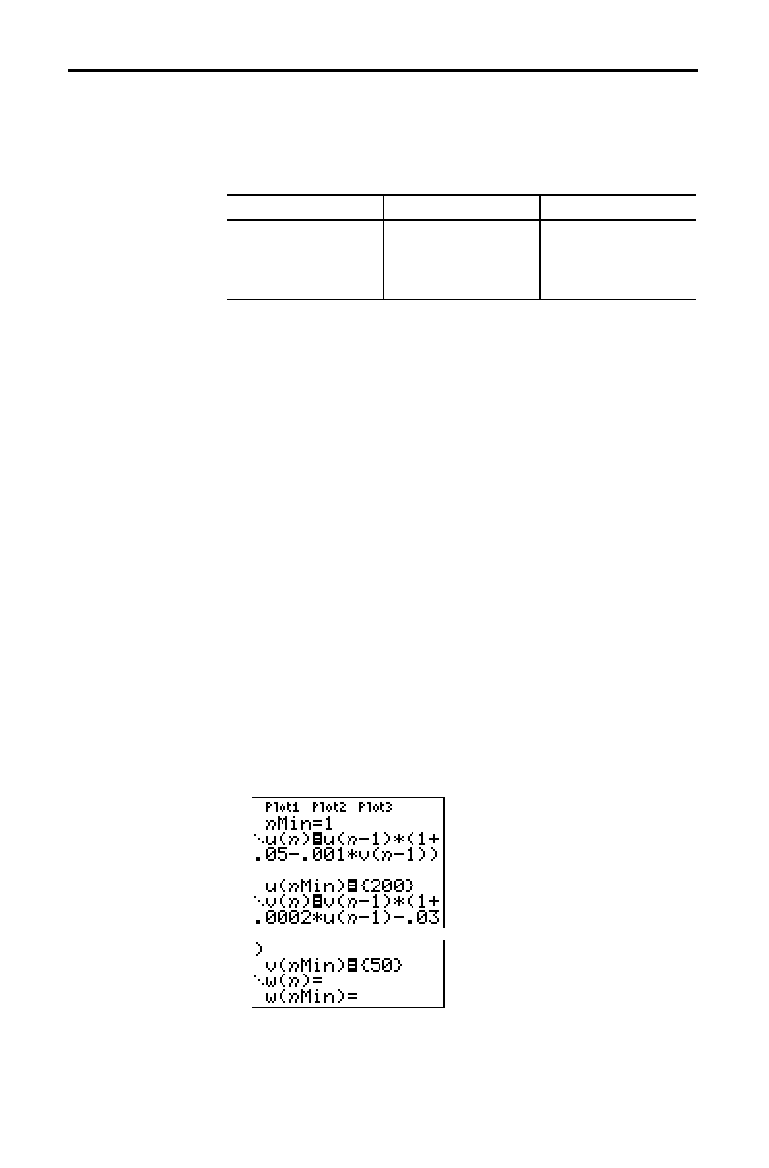
This example uses the model to determine the equilibrium
populations of wolves and rabbits, with initial populations
of 200 rabbits (
u(
n
Min)) and 50 wolves (v(
n
Min)).
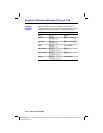
These are the variables (given values are in parentheses):
R = number of rabbits
M = rabbit population growth rate without wolves (.05)
K = rabbit population death rate with wolves (.001)
W = number of wolves
G = wolf population growth rate with rabbits (.0002)
D = wolf population death rate without rabbits (.03)
n
= time (in months)
R
n
=R
n
N
1
(1+M
N
KW
n
N
1
)
W
n
=W
n
N
1
(1+GR
n
N
1
N
D)
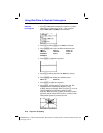
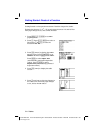
1. Press
o
in
Seq mode to display the sequence
Y=
editor.
Define the sequences and initial values for R
n
and W
n
as
shown below. Enter the sequence R
n
as u(
n
) and enter
the sequence W
n
as v(
n
).
Graphing Phase Plots
Graphing with uv,
vw, and uw
Example:
Predator-Prey
Model