


Sequence Graphing 6-3
8306SEQN.DOC TI-83 international English Bob Fedorisko Revised: 02/19/01 12:22 PM Printed: 02/19/01 1:36
PM Page 3 of 16
The steps for defining a sequence graph are similar to the
steps for defining a function graph. Chapter 6 assumes that
you are familiar with Chapter 3: Function Graphing.
Chapter 6 details aspects of sequence graphing that differ
from function graphing.
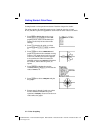
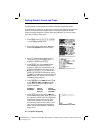
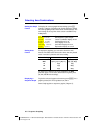
To display the mode screen, press
z
. To graph
sequence functions, you must select
Seq graphing mode
before you enter window variables and before you enter
sequence functions.
Sequence graphs automatically plot in
Simul mode,
regardless of the current plotting-order mode setting.
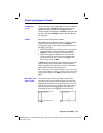
The TI
-
83 has three sequence functions that you can enter
from the keyboard:
u, v, and w. They are above the
¬
,
−
,
and
®
keys.
You can define sequence functions in terms of:
•
The independent variable
n
•
The previous term in the sequence function, such as
u(
n
N
1)
•
The term that precedes the previous term in the
sequence function, such as
u(
n
N
2)
•
The previous term or the term that precedes the
previous term in another sequence function, such as
u(
n
N
1)
or u(
n
N
2)
referenced in the sequence v(
n
).
Note:
Statements in this chapter about
u(
n
)
are also true for
v(
n
)
and
w(
n
)
; statements about
u(
n
N
1)
are also true for
v(
n
N
1)
and
w(
n
N
1)
;
statements about
u(
n
N
2)
are also true for
v(
n
N
2)
and
w(
n
N
2)
.
Defining and Displaying Sequence Graphs
TI-83 Graphing
Mode Similarities
Setting Sequence
Graphing Mode
TI-83 Sequence
Functions u, v,
and w