


12-8 Statistics
8312STAT.DOC TI-83 international English Bob Fedorisko Revised: 02/19/01 12:42 PM Printed: 02/19/01 1:37
PM Page 8 of 38
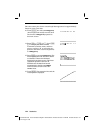
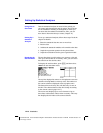
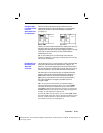
The new function y=.192x
.522
appears to fit the data well. To get more
information, examine a residual plot.
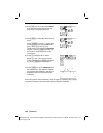
27. Press
o
to display the
Y=
editor.
Press
|
Í
to deselect
Y
1
.
Press
}
Í
to turn off plot 1. Press
~
Í
to turn on plot 2.
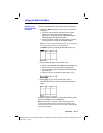
Note:
Step 19 defined plot 2 to plot residuals (
RESID
)
versus string length (
L
1
).
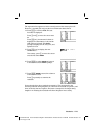
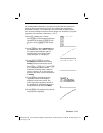
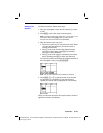
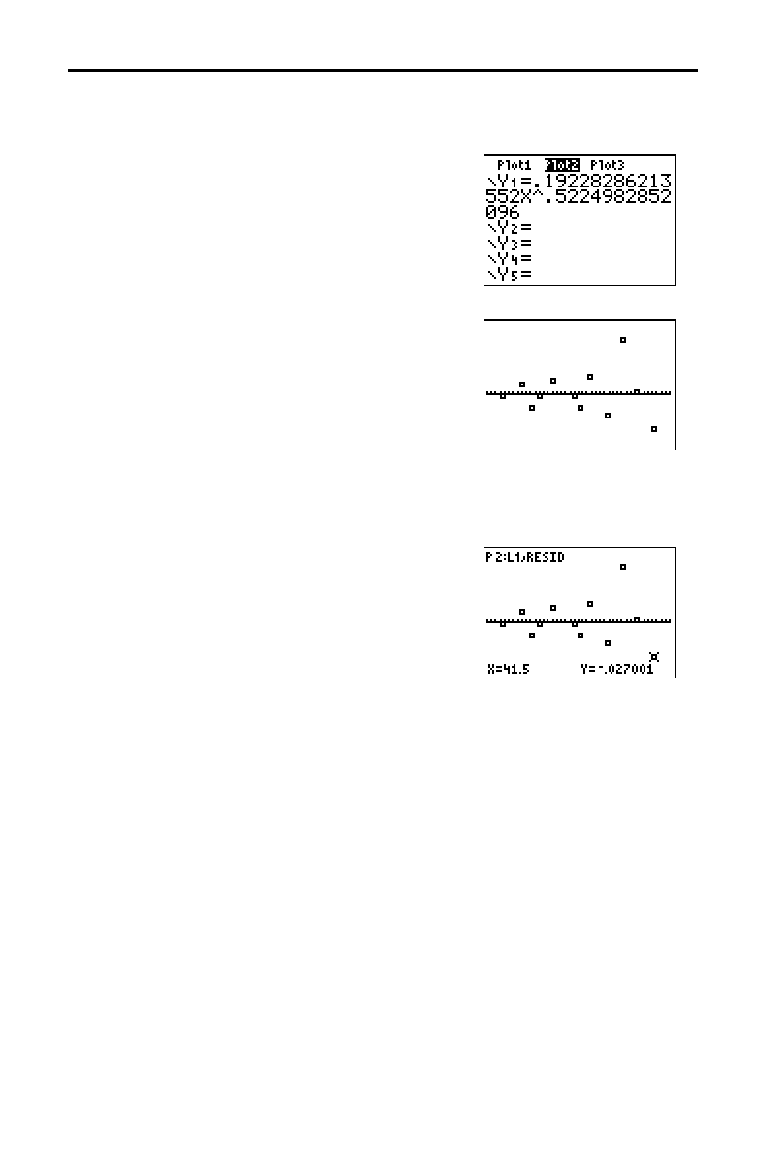
28. Press
q
9 to select 9:ZoomStat from
the
ZOOM
menu. The window variables
are adjusted automatically, and plot 2 is
displayed. This is a scatter plot of the
residuals.
The new residual plot shows that the residuals are random in sign, with the
residuals increasing in magnitude as the string length increases.
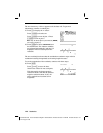
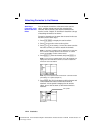
To see the magnitudes of the residuals, continue with these steps.
29. Press
r
.
Press
~
and
|
to trace the data.
Observe the values for
Y at each point.
With this model, the largest positive
residual is about 0.041 and the smallest
negative residual is about
L
0.027. All
other residuals are less than 0.02 in
magnitude.