


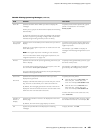

Viewing System Log Messages
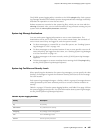
By default, the View Events page displays the most recent 25 events, with severity
levels highlighted in different colors. After you specify the filters, Event Summary
displays the events matching the specified filters. Click First, Next, Prev, and Last
links to navigate through messages. Table 87 on page 164 describes the Event
Summary fields.
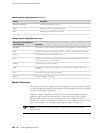
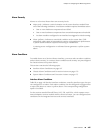
Table 87: Viewing System Log Messages
Additional InformationFunctionField
Displays the time at which the message was logged.Time
Displays the name and ID of the process that generated the
system log message.
Process
The event ID begins with a prefix that
indicates the generating software process.
Some processes on a Services Router do not
use codes. This field might be blank in a
message generated from such a process.
An Event can belong to one of the following
Type categories:
■
Error—Indicates an error or failure
condition that might require corrective
action.
■
Event—Indicates a condition or
occurrence that does not generally
require corrective action.
Displays a code that uniquely identifies the message.
The prefix on each code identifies the message source, and the
rest of the code indicates the specific event or error.
Displays context-sensitive help that provides more information
about the event:
■
Help—Short description of the message.
■
Description—More detailed explanation of the message.
■
Type—Category to which the message belongs.
■
Severity—Level of severity.
Event ID
Displays a more detailed explanation of the message.Event
Description
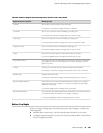
A severity level indicates how seriously the
triggering event affects routing platform
functions. When you configure a location for
logging a facility, you also specify a severity
level for the facility. Only messages from the
facility that are rated at that level or higher are
logged to the specified file.
Severity level of a message is indicated by different colors.
■
Unknown—Gray—Indicates no severity level is specified.
■
Debug/Info/Notice—Green— Indicates conditions that are
not errors but are of interest or might warrant special
handling.
■
Warning—Yellow—Indicates conditions that warrant
monitoring.
■
Error—Blue— Indicates standard error conditions that
generally have less serious consequences than errors in
the emergency, alert, and critical levels.
■
Critical—Pink—Indicates critical conditions, such as hard
drive errors.
■
Alert—Orange—Indicates conditions that require
immediate correction, such as a corrupted system
database.
■
Emergency—Red—Indicates system panic or other
conditions that cause the routing platform to stop
functioning.
Severity
164 ■ Monitoring System Log Messages with the J-Web Event Viewer
J-series™ Services Router Administration Guide