


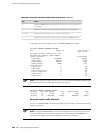
This example displays only mtrace queries. When the Services Router captures an
mtrace response, the display is similar, but the complete mtrace response is also
displayed—exactly as it is displayed in mtrace from-source command output.
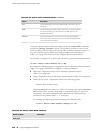
Table 126 on page 244 summarizes the output fields of the display.
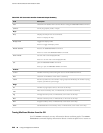
Table 126: CLI mtrace monitor Command Output Summary
DescriptionField
■
operation-type—Type of multicast trace operation: query or response.
■
time-of-day—Date and time the multicast trace query or response was captured.
Mtrace operation-type at time-of-day
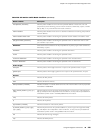
IP address of the host issuing the query.
by
address—Response destination address.
resp to address
qid—Query ID number.
qid qid
■
source—IP address of the source of the query or response.
■
destination—IP address of the destination of the query or response.
packet from source to destination
■
source—IP address of the multicast source.
■
destination—IP address of the multicast destination.
from source to destination
address—Group address being traced.
via group address
number—Maximum hop setting.
mxhop=number
Displaying Log and Trace Files from the CLI
You can enter the monitor start command to display real-time additions to system
logs and trace files:
user@host> monitor start filename
When the Services Router adds a record to the file specified by filename, the record
is displayed on the screen. For example, if you have configured a system log file
named system-log (by including the syslog statement at the [edit system] hierarchy
level), you can enter the monitor start system-log command to display the records
added to the system log.
To display a list of files that are being monitored, enter the monitor list command.
To stop the display of records for a specified file, enter the monitor stop filename
command.
244 ■ Using CLI Diagnostic Commands
J-series™ Services Router Administration Guide