


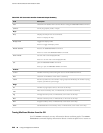
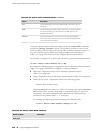

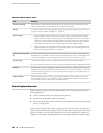

Table 129: CLI monitor traffic Command Options (continued)
DescriptionOption
(Optional) Displays minimum packet header information. This is
the default.
brief
(Optional) Displays packet header information in moderate detail.
For some protocols, you must also use the size option to see
detailed information.
detail
(Optional) Displays the most extensive level of packet header
information. For some protocols, you must also use the size option
to see extensive information.
extensive
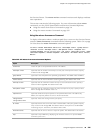
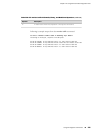
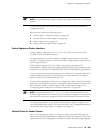
To limit the packet header information displayed by the monitor traffic command,
include the matching "expression" option. An expression consists of one or more
match conditions listed in Table 130 on page 248, enclosed in quotation marks (" ").
You can combine match conditions by using the logical operators listed in
Table 131 on page 250 (shown in order of highest to lowest precedence).
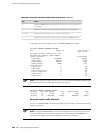
For example, to display TCP or UDP packet headers, enter the following command:
user@host> monitor traffic matching “tcp || udp”
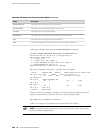
To compare the following types of expressions, use the relational operators listed in
Table 132 on page 250 (listed from highest to lowest precedence):
■ Arithmetic—Expressions that use the arithmetic operators listed in
Table 132 on page 250.
■ Binary—Expressions that use the binary operators listed in Table 132 on page 250.
■ Packet data accessor—Expressions that use the following syntax:
protocol [byte-offset <size>]
Replace protocol with any protocol in Table 130 on page 248. Replace byte-offset
with the byte offset, from the beginning of the packet header, to use for the
comparison. The optional size parameter represents the number of bytes
examined in the packet header—1, 2, or 4 bytes.
For example, the following command displays all multicast traffic:
user@host> monitor traffic matching “ether[0] & 1 !=0”
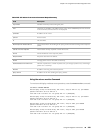
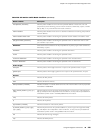
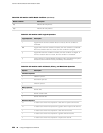
Table 130: CLI monitor traffic Match Conditions
DescriptionMatch Condition
Entity Type
248 ■ Using CLI Diagnostic Commands
J-series™ Services Router Administration Guide