


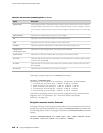
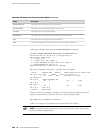

Table 128: CLI monitor interface traffic Output Control Keys (continued)
ActionKey
Displays the Delta column instead of the rate column—in bps or packets per
second (pps).
d
Displays the statistics in units of packets and packets per second (pps).p
Quits the command and returns to the command prompt.q or ESC
Displays the rate column—in bps and pps—instead of the Delta column.
r
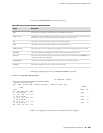
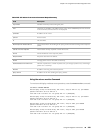
Following are sample displays from the monitor interface command:
user@host> monitor interface fe-0/0/0
host1 Seconds: 11 Time: 16:47:49
Delay: 0/0/0
Interface: fe-0/0/0, Enabled, Link is Up
Encapsulation: Ethernet, Speed: 100mbps
Traffic statistics: Current delta
Input bytes: 381588589 [11583]
Output bytes: 9707279 [6542]
Input packets: 4064553 [145]
Output packets: 66683 [25]
Error statistics:
Input errors: 0 [0]
Input drops: 0 [0]
Input framing errors: 0 [0]
Carrier transitions: 0 [0]
Output errors: 0 [0]
Output drops: 0 [0]
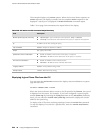
NOTE: The output fields displayed when you enter the monitor interface interface-name
command are determined by the interface you specify.
user@host> monitor interface traffic
Interface Link Input packets (pps) Output packets (pps)
fe-0/0/0 Up 42334 (5) 23306 (3)
fe-0/0/1 Up 587525876 (12252) 589621478 (12891)
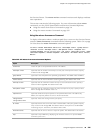
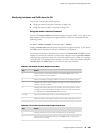
Using the monitor traffic Command
Use the CLI monitor traffic command to display packet headers transmitted through
network interfaces.
NOTE: Using the monitor traffic command can degrade Services Router performance.
We recommend that you use filtering options—such as count and matching—to
minimize the impact to packet throughput on the Services Router.
246 ■ Using CLI Diagnostic Commands
J-series™ Services Router Administration Guide