


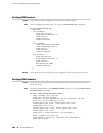
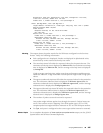


Minimum Rtt: 1093 usec, Maximum Rtt: 1372 usec, Average Rtt: 1231 usec,
Jitter Rtt: 279 usec, Stddev Rtt: 114 usec
Probes sent: 3, Probes received: 3, Loss percentage: 0
Owner: Rpm-Bgp-Owner, Test: Rpm-Bgp-Test-1
Target address: 10.209.152.37, Probe type: icmp-ping, Test size: 5 probes
Routing Instance Name: LR1/RI1
Probe results:
Response received, Fri Oct 28 05:20:23 2005
Rtt: 662 usec
Results over current test:
Probes sent: 5, Probes received: 5, Loss percentage: 0
Measurement: Round trip time
Minimum: 529 usec, Maximum: 662 usec, Average: 585 usec,
Jitter: 133 usec, Stddev: 53 usec
Results over all tests:
Probes sent: 5, Probes received: 5, Loss percentage: 0
Measurement: Round trip time
Minimum: 529 usec, Maximum: 662 usec, Average: 585 usec,
Jitter: 133 usec, Stddev: 53 usec
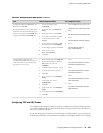
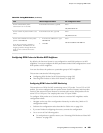
Meaning The output shows the probe results for the RPM tests configured on the Services
Router. Verify the following information:
■ Each configured test is displayed. Results are displayed in alphabetical order,
sorted first by owner name and then by test name.
■ The round-trip times fall within the expected values for the particular test. The
minimum round-trip time is displayed as Minimum Rtt, the maximum round-trip
time is displayed as Maximum Rtt, and the average round-trip time is displayed
as Average Rtt.
A high average round-trip time might mean that performances problems exist
within the network. A high maximum round-trip time might result in high jitter
values.
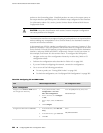
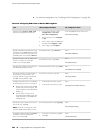
■ The egress (outbound) trip times fall within the expected values for the particular
test. The minimum outbound time is displayed as Minimum egress time, the
maximum outbound time is displayed as Maximum egress time, and the average
outbound time is displayed as Average egress time.
■ The ingress (inbound) trip times fall within the expected values for the particular
test. The minimum inbound time is displayed as Minimum ingress time, the
maximum inbound time is displayed as Maximum ingress time, and the average
inbound time is displayed as Average ingress time.
■ The number of probes sent and received is expected.
Lost probes might indicate packet loss through the network. Packet losses can
occur if the remote server is flapping. If the RPM probe type is TCP or UDP,
complete probe loss might indicate a mismatch in TCP or UDP RPM port number.
■ For Type, each peer is configured as the correct type (either internal or external).
Related Topics For a complete description of show services rpm probe-results output, see the JUNOS
System Basics and Services Command Reference.
Verifying RPM Statistics ■ 287
Chapter 14: Configuring RPM Probes