


edge switch 2/16 service manual 3–25
Repair Information
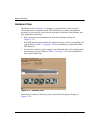
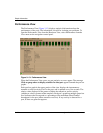
A red indicator on each port bar graph (high-water mark) remains at the highest level
the graph has reached since the Performance View was opened. The indicator does not
appear if the port is offline, and is reset to the bottom of the graph if the port detects a
loss of light.
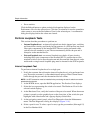
When the mouse pointer is passed over a port bar graph, the graph highlights with a
blue border and an information pop-up displays adjacent to the port as follows:
• If a device is not attached to the port, the pop-up displays the port’s current state.
• If a device is attached to the port, the pop-up displays the WWN of the attached
device.
• If the port is an E_Port, the pop-up displays E_Port.
• If the port is segmented, the pop-up displays Segmented E_Port.
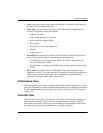
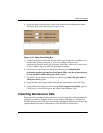
Click a port bar graph to display statistics values for the port (bottom half of the
Performance View). Right-click a port bar graph to display statistics values for the
port (bottom half of the Performance View) and access a menu to:
• Open the Port Properties, Node Properties, or Port Technology dialog boxes.
• Block or unblock the port.
• Enable or disable port beaconing.
• Perform port diagnostics.
• Enable or disable port channel wrapping. This menu option appears only when the
switch is configured for S/390 operating mode.
• Swap one Fibre Channel port address with another. This menu option appears
only when the switch is configured for S/390 operating mode.
• Clear link incident alerts.
• Reset the port.
• Configure Port Binding.
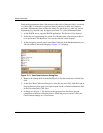
When a port is selected, the bottom half of the Performance View displays the
following tables of cumulative port statistics and error count values. These statistics
correspond to values defined in the Fabric Element management information base
(MIB).
• Traffic statistics.
• Class 2 statistics.
• Class 3 statistics.