


1–34 edge switch 2/16 service manual
General InformationI
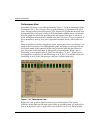
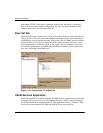
Performance View
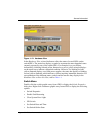
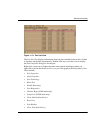
Select the Performance view tab from the menu. Figure 1–16 shows an example of the
Performance View. This view provides a graphical display of performance for all 16
ports. The top portion of the Performance View displays bar graphs that show the level
of transmit/receive activity for each port. This information updates every five seconds.
Each bar graph also shows the percentage link utilization for the port. A red arrow
marks the highest utilization level reached since the Performance View was opened. If
the system detects activity on a port, it represents minimal activity with at least one
bar.
When an end device (node) is logged into a port, moving the cursor over the port’s bar
graph in the Performance View highlights the graph and displays a message with the
world-wide name of the connected node. If the connected node has more than one
port, this is the world-wide name of the specific port on the node. When a port is
functioning as an expansion port (E_Port), the message is “E_Port.” When a port is
not logged into an end-device (not functioning as an F_Port) or to another switch (not
functioning as an E_Port), the message is the port’s current online state.
Figure 1–16: Performance View
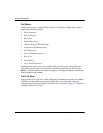
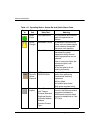
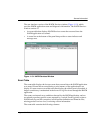
Right-click a bar graph to display a menu of port-related actions. The options
available on this menu are the same as those that are available when you right-click a
port in the Hardware View or right-click a row in the Port List View. These include: