6-16
Surveyor
User’s Guide
If you attempt to select an area smaller than 20MB, the closest sections that form
20MB of data become the Capture Selection Window.
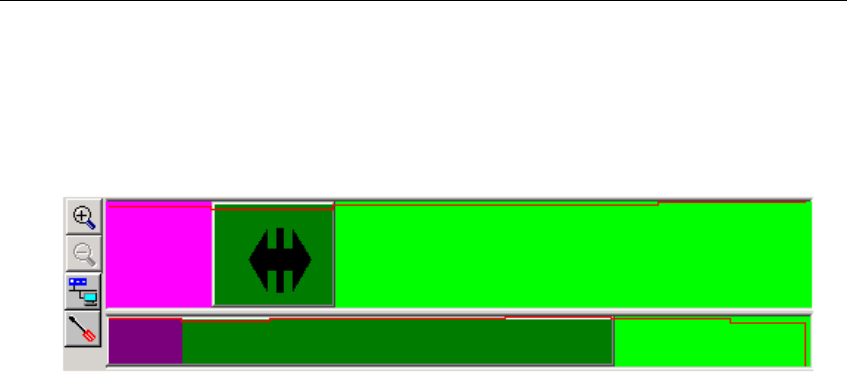
The picture below shows double-arrow mouse icon in the Upper Histogram. The
special mouse icons described above only appear when the mouse is over an area
that will respond to cursor actions.
Figure 6-4. Histogram Showing Mouse Control
Right Mouse Options in the Histogram
A right mouse brings up a menu of display options for both histograms. Depending
on the data, changing the settings can give you a better visual display of transition
points and high/low values.
•
Line Graph or Stair Step
A line graph smooths out visual transitions for low to high and high to low. Stair
Step is the default.
•
Linear Scale or Logarithmic Scale
Linear scale can show larger visual differential between high and low values
than the logarithmic scale. Linear Scale is the default.
•
Options
Brings up the dialog box to set the configuration options for the histogram. See
“Histogram Options” on page 4-4 for information on the histogram configura-
tion options.
Saving Portions of the Data
You can save all or part of a capture using the histogram. Use the
Save Current
Selection...
option from the File menu to save the Current Section of the histogram.
The Current Section contains the packets that are currently decoded and displayed in
the Summary area. You can also save a specific set of frames within the Current
Section.
Use the
Save Histogram... option from the File menu to save the entire capture or a
large range of the data. To save a range, select the
Range of downloaded sections
