10-10
Surveyor
User’s Guide
Expert Symptoms, Analyses, and Network Entities
When you capture or monitor packets on a network segment, Surveyor immediately
begins constructing a database of network entities from the traffic it sees. Surveyor
uses protocol decoding to learn all about the connections, network stations, routing
nodes, and subnetworks related to the frames in the capture buffer. From this infor-
mation, Surveyor can detect potential problems on the network. These problems are
categorized as symptoms or analyses. Alarms can be set to automatically alert you
as these potential problems are discovered.
When viewing expert symptoms or analyses in the Summary area, double-click on a
Frame ID to jump to that frame in Capture View. Capture View shows the frame
decode. Double-click on an address to jump to a table highlighting an entry
describing the associated entity.
Symptoms
When the Expert detects an abnormal or unusual network event, it logs a symptom.
A symptom indicates that a threshold has been exceeded and may indicate a
problem on your network. Counters for symptoms can be used to trigger alarms.
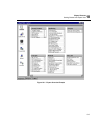
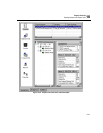
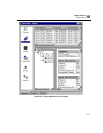
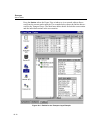
Press the
Symptoms tab on the Expert window to view network events that may
result in network problems. See Figure 10-1 and Figure 10-3 for examples of
displays of symptoms.
Tables in the Detail Area for Symptoms
The first list displays which types of symptoms and how many of them are found in
the connections between the two network stations.
The second list displays the network traffic of the first network station. It shows
how many packets and bytes of data are sent and received by the station. It shows
how many broadcast packets the station sent and the MAC addresses associated to
the station.
The third list displays the network traffic of the second network station, if present.
The fourth list displays the network traffic between the two network stations. It
shows how many packets and bytes of data are sent from the first to the second and
the second to the first.


