11-11
Multi-QoS
Call Range Graphs and Summaries
11
Call Range Graphs and Summaries
Each tab in the interface except the utilization and configuration tabs brings up a
range breakdown of calls using the selected metric.
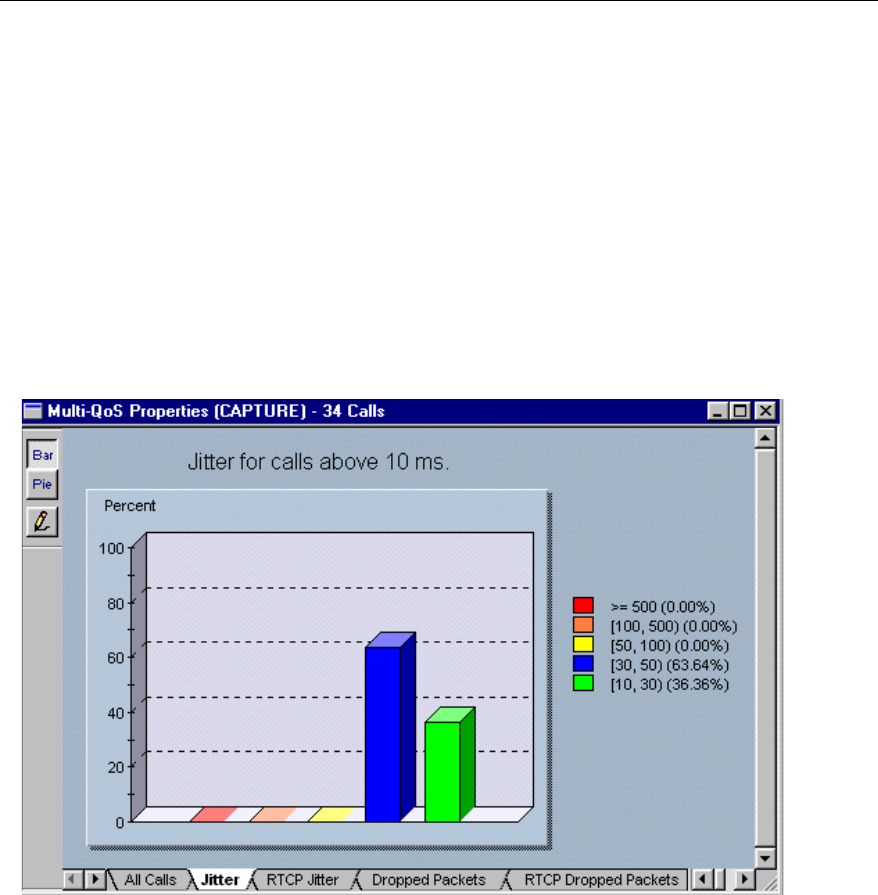
Call Jitter, Call RTCP Jitter, Call Setup Time
Figure 11-4 shows an example of the
Call Jitter tab in the Multi-QoS View window.
Double-click on a section of the bar or pie graph to see a table of calls for the
selected jitter range.
Click on the “pencil” button to change the ranges for jitter in the graph. A
Range
Editor
dialog box appears which allows you to modify ranges for this chart type.
Call RTCP Jitter and Call Setup Time displays and configuration are identical to
Call Jitter.
Figure 11-4. Multi-QoS Jitter Graph Example
The title of the graph indicates the minimum value for the selected metric. All calls
that meet this minimum value are included in the graphic breakdown. Calls that do
not meet this minimum are not included. In the example on the next page, all calls
that have a Jitter value greater than 10ms are included. Note that this means the total
number of calls in a capture will not necessarily match the total number of calls in
the graphic breakdown.


