10-2
Surveyor
User’s Guide
Expert System Views
The expert views present expert information on capture files, a capture buffer, or in
monitoring mode. The following Expert views are available from the
Data Views or
Capture View toolbar:
Expert View
Expert views are available from the Data Views or Capture View toolbars,
if supported by the current resource. The Expert system presents a matrix of
different views showing network symptoms, analyses, and entities by proto-
col layer. Also, an Expert Diagnostic Message showing the definition, pos-
sible causes, and suggested actions can be obtained for any symptom or
analyses.
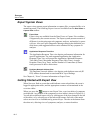
Application Response Time View
The Application Response Time view depicts performance information for
specific applications. For each supported application the Application
Response Time View will present the Application, Minimum Response
Time (Min Time), Maximum Response Time (Max Time), Average
Response Times (Avg Time), and the Number of Connections (Connec-
tions) processed to derive these times.
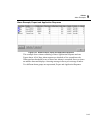
Duplicate Network Address View
The Duplicate Network Address view depicts each duplicate network (IP/
IPX) address detected and its associated MAC layer bindings.
See Chapter 6, “Views” for more information on Expert Views.
Getting Started with Expert View
When Surveyor finds an event that could indicate a network problem, the event is
logged in appropriate tables, and the appropriate counters are incremented in the
overview tables.
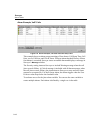
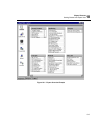
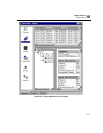
When you press the button to start Expert View, overview tables of symptoms
are displayed. An example of the symptom overview tables is shown in Figure 10-1.
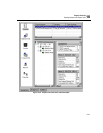
You can access different expert views by clicking one of the layer buttons to the left
of the tables, or by selecting one of the tabs at the bottom. One side of the matrix
selects an overview or a breakdown by protocol layer. The tabs at the bottom form
the other axis, allowing views of symptoms, analyses, or network entities.


