


11-17
Multi-QoS
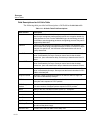
VQMon Metrics
11
If you would like more detailed information about how R-factors are calculated,
please call Finisar customer support. The R-factors used in Multi-QoS extend the
ITU standard E Model for estimating transmission quality.
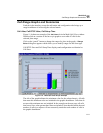
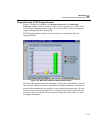
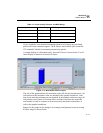
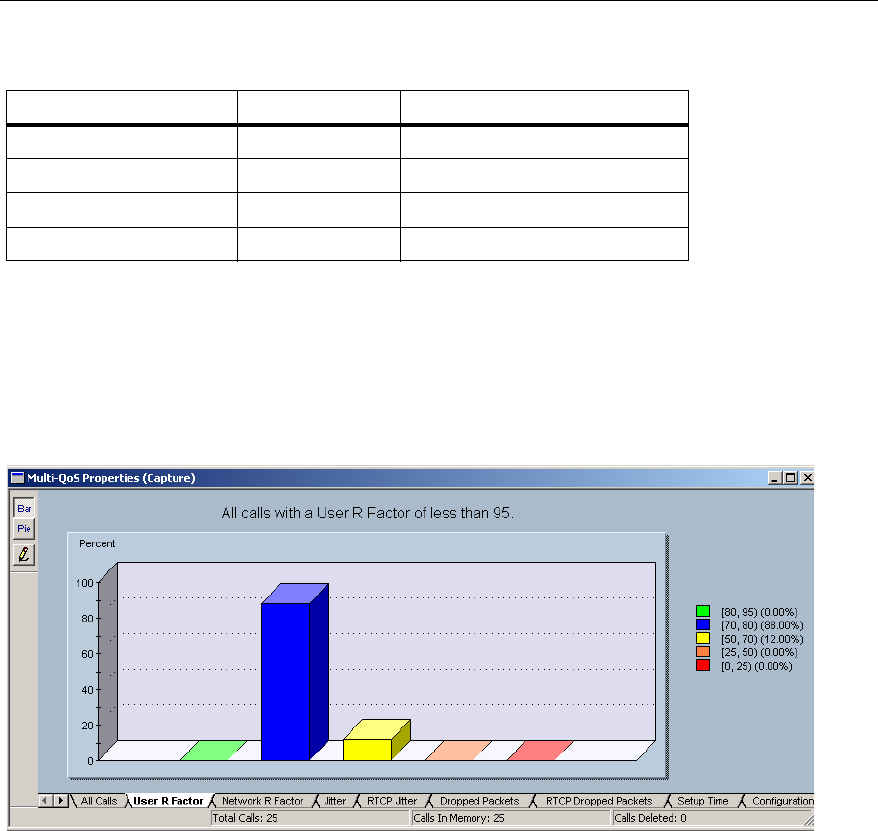
A sample display of call breakdown by Network R-factor is shown below. User R-
factor display is identical to Network R-factor.
Figure 11-8. Multi-QoS R-factor Example
The title of the graph indicates the maximum value (80) for the selected metric. All
calls that meet this minimum value are included in the graphic breakdown. Calls
that do not meet this minimum are not included. In the example on the next page, all
calls that have an R-factor of less than 80 are included. Note that this means the
total number of calls in a capture will not necessarily match the total number of
calls in the graphic breakdown.
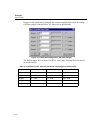
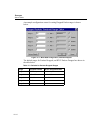
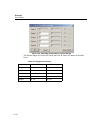
Ranges for the graph can be changed. An example configuration screen for setting
R-factor ranges is shown below.
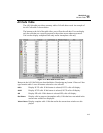
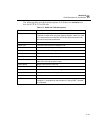
Table 11-5. Voice Quality, R-factors, and MOS Range
Desirability Scale R-factor Range MOS Range
Desirable 94 - 80 4.4 - 4.0
Acceptable 80 - 70 4.0 - 3.6
Reach Connection 70 - 50 3.6 - 2.6
Not Recommended 50 - 0 2.6 - 1