10-4
Surveyor
User’s Guide
Expert Overview Details
Click on any counter in the display to view a table listing only the events for the
selected symptom. The display has a summary area showing all symptoms and a
detail area for the current selected symptom.
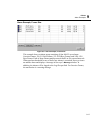
The summary area contains a table showing frame ID (Capture View only), source
address, destination address, VLAN ID, timestamp and other information for each
event. Each table entry shows a summary in the
Expert Summary field that provides
more information about the symptom. The Expert Overview Detail table contains
the last 2,000 symptoms for each protocol layer.
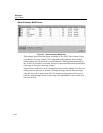
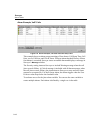
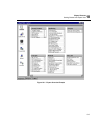
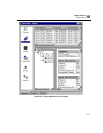
An example of the overview detail tables, after clicking on the TCP Retransmissions
counter, is shown in Figure 10-2. The summary area (top) lists all occurrences of the
selected symptom. The detail area (bottom left) shows an object tree view of the
symptom selected in the summary area. This provides information about the stations
and ports that are associated with the selected symptom. The vital statistics for the
symptom selected in the summary area is shown in the detail area to the right. The
first table shows other symptoms discovered for this conversation. Detailed statis-
tics for each entity in the conversation and statistics for the conversation itself are
also included.
The summary and detail areas are separated by large gray bars (one vertical and one
horizontal) which can be used to size each area as needed.
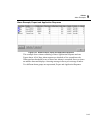
Click on a column header to sort the symptoms in the summary area by the values in
the column. Clicking a column header a second time changes the sort order from
descending to ascending.


