Release 1.0, 1 July 2002 F. Chapter Q Performance Instrumentation 203
for(i=0; i<=pcr.nc; i++) {
/* assume rest of pcr data has been preserved */
pcr.sc = i;
wr_pcr(pcr);
pic = rd_pic();
picl[i] = pic.picl;
picu[i] = pic.picu;
}
Q.2 Performance Monitor Description
The performance monitors can be divided into the following groups:
1. Instruction statistics
2. Trap statistics
3. MMU event counters
4. Cache event counters
5. UPA transaction event counters
6. Miscellaneous counters
Events in Group 1 are counted on commit of the instructions. The instructions
executed speculatively are not counted. Events in groups 2 through 5 are counted
when they occur. All event counters implemented in SPARC64 V are listed in
TABLE Q-1
.
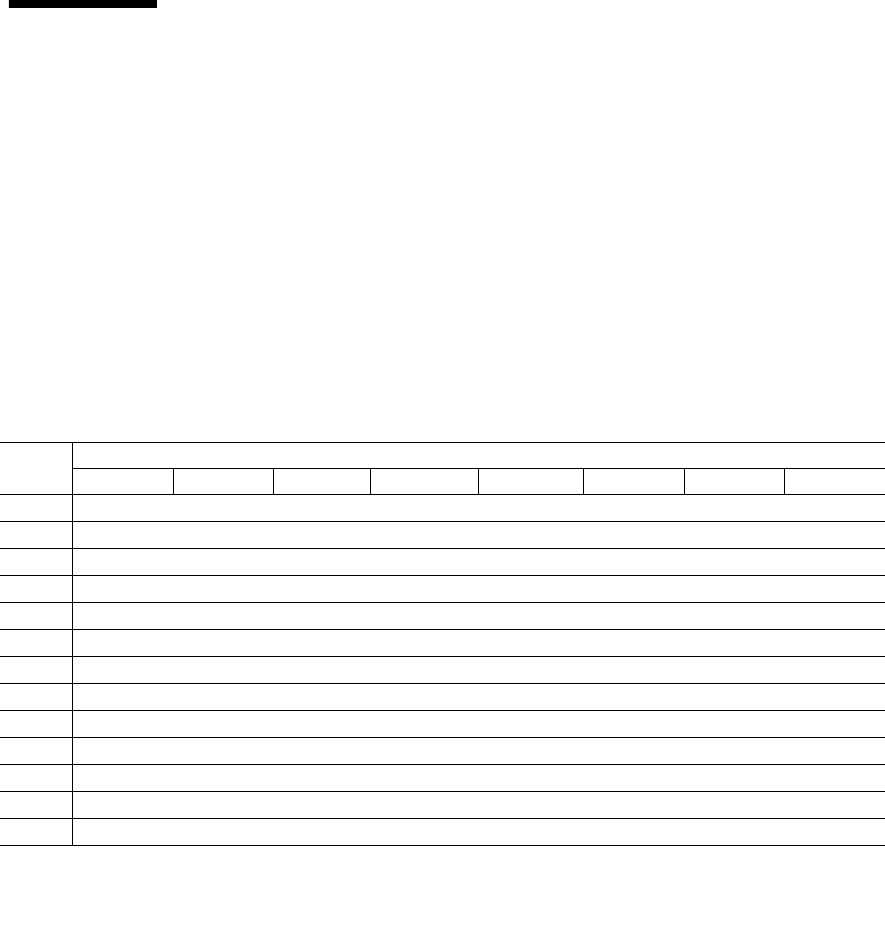
TABLE Q-1
Events and Encoding of Performance Monitor
Encoding
Counter
picu0 picl0 picu1 picl1 picu2 picl2 picu3 picl3
000000 cycle_counts
000001 instruction_counts
000010 Reserved
000011 Reserved
000100 Reserved
000101 Reserved
000110 Reserved
000111 Reserved
001000 load_store_instructions
001001 branch_instructions
001010 floating_instructions
001011 impdep2_instructions
001100 prefetch_instructions


