2 - 41
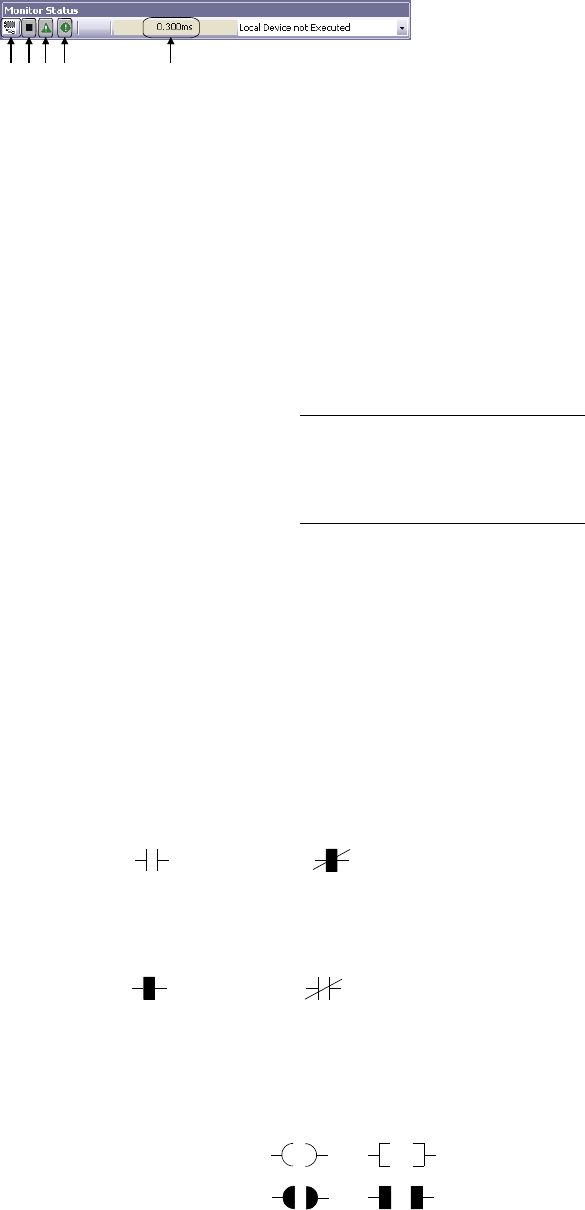
(1) In the monitor mode, the Monitor Status dialog box shown below is displayed
regardless of the monitor status.
1) 2) 5)3) 4)
1) Connection status
Displays the connection status between a programmable controller
CPU and personal computer in which the simulation function is started.
2) RUN/STOP status
Displays the programmable controller CPU status operated by the key
switch on the programmable controller CPU or the remote operation
from GX Works2.
3) ERR. status (PLC diagnostics)
Displays the error status of the programmable controller CPU.
Clicking the icon displays the PLC Diagnostics screen (*1)
.
4) USER status (PLC diagnostics)
Displays the user error status of the programmable controller CPU.
Clicking the icon displays the PLC Diagnostics screen (*1)
.
5) Scan time
Displays the maximum scan time of the monitored programmable
controller CPU.
The Q-series programmable controller displays the scan time in units
of 0.1msec.
*1: For the PLC diagnostics, refer to section 2.8.
(2) The statuses of the ladder are indicated as shown below.
1) Display of a contact when X0 = OFF
X0 X0
Normally open contact
(not conducting)
Normally closed contact
(conducting)
Display of a contact when X0 = ON
X0
X0
Normally open contact
(conducting)
Normally closed contact
(not conducting)
2) Display of a coil output instruction, contact-equivalent comparison
instruction, and coil-equivalent instruction
Not executed,
conditions not established
Executed,
conditions established
*
*
*: Available contact-equivalent comparison and coil-equivalent
instructions are SET, RST, PLS, PLF, SFT, SFTP, MC, FF, DELTA,
and DELTAP.


