Debug
ARM DDI 0363E Copyright © 2009 ARM Limited. All rights reserved. 11-54
ID013010 Non-Confidential, Unrestricted Access
11.11 Using the debug functionality
This section provides some examples of using the processor debug functionality, both from the
point of view of a software engineer writing code to run on an ARM processor and of a
developer creating debug tools for the processor. In the former case, examples are given in ARM
assembly language. In the latter case, the examples are in C pseudo-language, intended to
convey the algorithms to be used. These examples are not intended as source code for a
debugger.
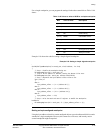
The debugger examples use a pair of pseudo-functions such as the following:
uint32 ReadDebugRegister(int reg_num)
{
// read the value of the debug register reg_num at address reg_num << 2
}
WriteDebugRegister(int reg_num, uint32 val)
{
// write the value val to the debug register reg_num at address reg_num >> 2
}
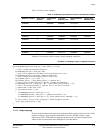
A basic function for using the debug state is executing an instruction through the ITR.
Example 11-1 shows the sequence for executing an ARM instruction through the ITR.
Example 11-1 Executing an ARM instruction through the ITR
ExecuteARMInstruction(uint32 instr)
{
// Step 1. Poll DSCR until InstrCompl is set.
repeat
{
dscr := ReadDebugRegister(34);
}
until (dscr & (1<<24));
// Step 2. Write the opcode to the ITR.
WriteDebugRegister(33, instr);
// Step 3. Poll DSCR until InstrCompl is set.
repeat
{
dscr := ReadDebugRegister(34);
}
until (dscr & (1<<24);
}
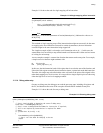
This section describes:
• Debug communications channel on page 11-55
• Programming breakpoints and watchpoints on page 11-57
• Single-stepping on page 11-60
• Debug state entry on page 11-61
• Debug state exit on page 11-62
• Accessing registers and memory in debug state on page 11-63
• Emulating power down on page 11-71.


