Document No. 10-300077, Issue 2 21-17
Monitoring the Avaya Multiservice Switch
Configuring Utilization Monitoring
Overview
Utilization monitoring makes it possible for you to monitor utilization of
the:
■ CPU—the number of packets per second that the CPU on the
supervisor module routes (slow path).
■ Forwarding engine—the number of packets per second that the 80-
series forwarding engines route. This statistic includes packets
routed by the forwarding engines on 80-series media modules
(FIRE) and on the supervisor module (FORE).
For more information about the slow path and FIRE and FORE paths, see
“Routing Overview” in Chapter 1, “Introduction.”
For each of these statistics, you can set a high threshold. If this threshold is
exceeded, the switch logs the event in the event log, displays a message in
the CLI, and sends an SNMP trap to the Trap receiver.
This section contains procedures for the following tasks:
■ Enabling Utilization Monitoring
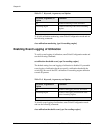
■ Enabling Event Logging of Utilization
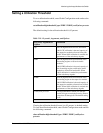
■ Setting a Utilization Threshold
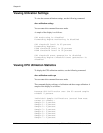
■ Viewing Utilization Settings
■ Viewing CPU Utilization Statistics
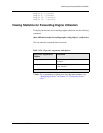
■ Viewing Statistics for Forwarding Engine Utilization
You can configure utilization monitoring only by using the CLI. This
feature is not available in the Web Agent.
Enabling Utilization Monitoring
To enable utilization monitoring, enter Global Configuration mode and use
the following command:
set utilization monitoring {cpu | forwarding-engine}
The default setting for utilization monitoring is disabled.


