Document No. 10-300077, Issue 2 23-3
Using RMON and Ethernet Statistics to Analyze Network Performance
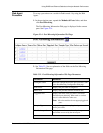
4. Click Clear Counters to get a fresh view of the statistics being gathered.
This resets all of the counters to zero so that you can track the counters
from a particular point forward.
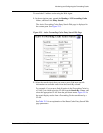
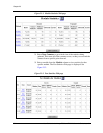
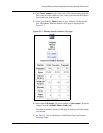
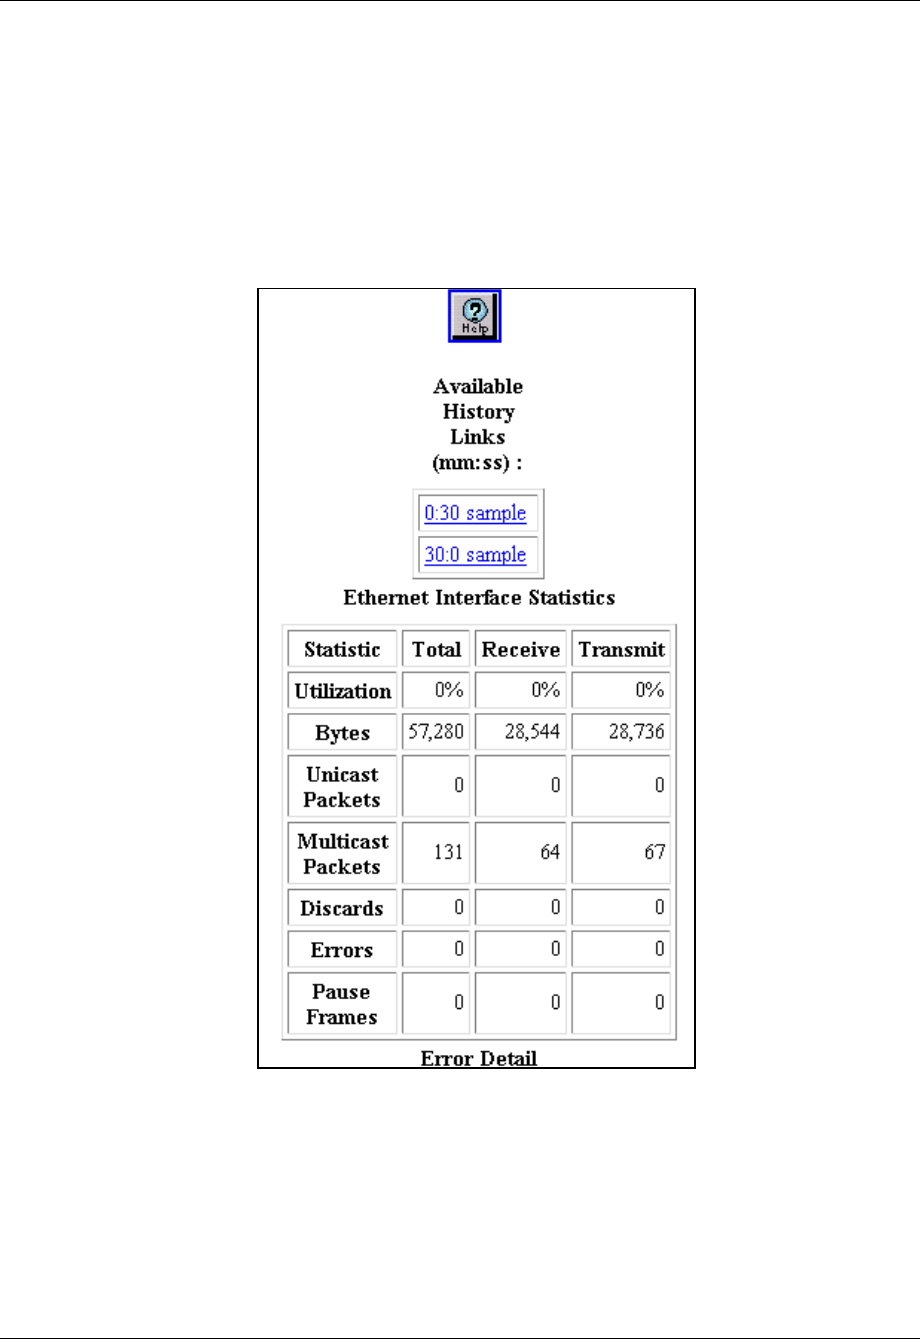
5. Select a port from the Name column to view statistics for that specific
port. The Ethernet Interface Statistics Web page is displayed. See
Figure 23-3.
Figure 23-3. Ethernet Interface Statistics Web page
6. Select either 0:30 sample (30 second sample) or 30:0 sample (30 minute
sample) from the Available History Links field.
The Ethernet Interface Statistics Web page is displayed with the sample
you selected.
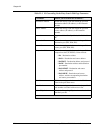
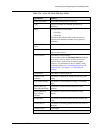
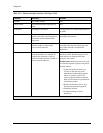
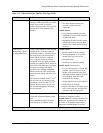
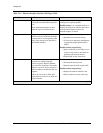
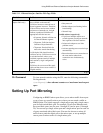
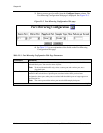
7. See Table 23-1 for an explanation of the Ethernet Interface Statistics
Web page fields:


