


100 Running interactive activities
Note: The class’s points may change if you create the list before your
classmates have all contributed their points or if your teacher gives the
class the option of resubmitting points. You can update the list of class
points by selecting
Get.
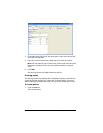
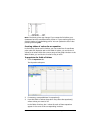
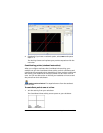
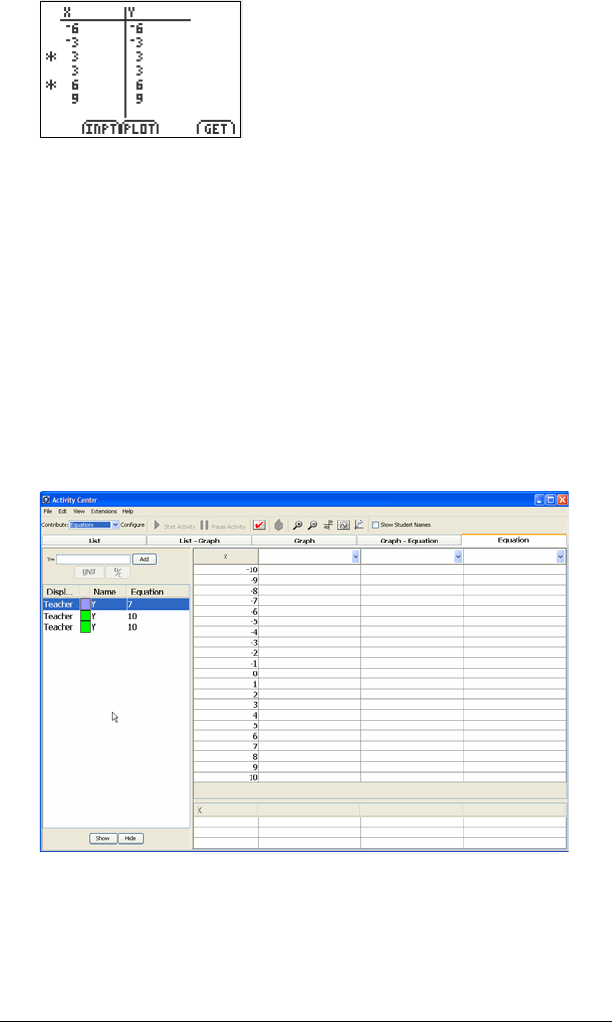
Creating tables of values for an equation
In the Activity Center tool’s window, you can create lists of coordinate
pairs under the Equation tab. In the Table of Values, you can list the Y
values for X values within the current range of the graph window. In the
What if table, you can list the Y value for any X value.
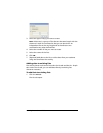
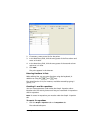
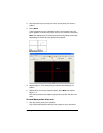
To populate the Table of Values
1. Click the Equation tab.
The Equation tab opens.
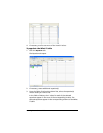
2. If necessary, create additional Y= equation(s).
3. From the Table of Values drop-down lists, select the equation(s)
whose values you want to list.
In the Table of Values, the Y values for each of these equations
appear in the rows of the corresponding X values.