


114 Running interactive activities
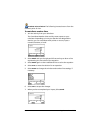
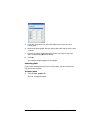
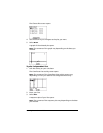
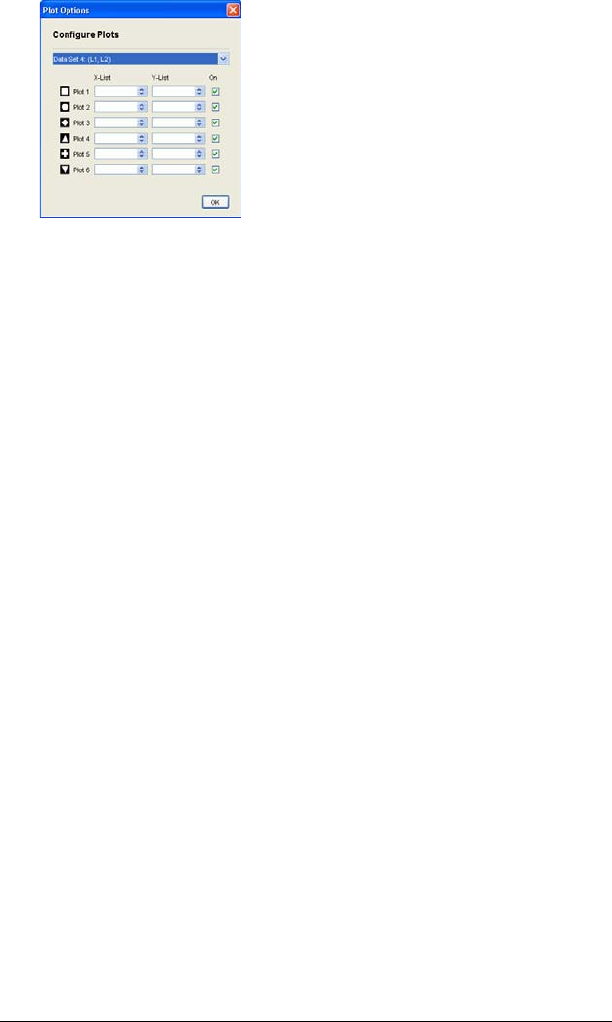
3. From the drop-down list, select the data set you want to use to
create plots.
4. Next to the plot symbol that you want, select the lists for your X and
Y values.
5. If there are other configured plots you do not want to use, clear
their corresponding
On check boxes.
6. Click OK.
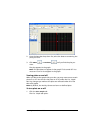
The configured plot appears in the graph.
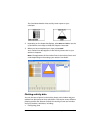
Selecting plots
If you create multiple plots for your activity data, you can switch from
one plot to the another.
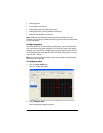
To select plots
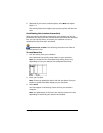
1. Click the List - Graph tab.
The List - Graph tab opens.