


62 Running interactive activities
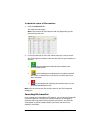
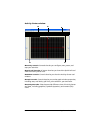
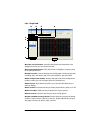
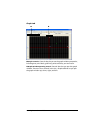
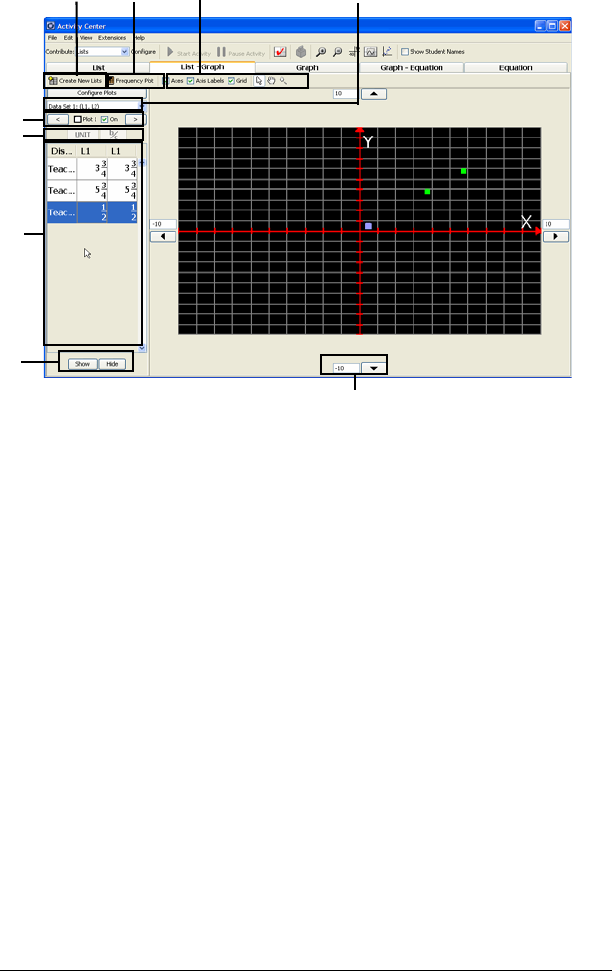
List - Graph tab
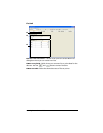
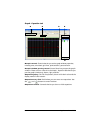
Ê Create new list button. A button that opens the Create New Lists
dialog box where you can create new lists.
Ë
Frequency Plots button. Click this button to display a frequency plot
for a selected data set.
Ì
Graph controls. Controls that let you set the graph window properties,
including axes, axis labels, grid lines, point selection, pan and zoom.
Í
Plot configuration button. Button that opens the Plot configuration
window, where you can configure plots for the data sets.
Î
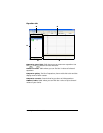
Data set list. Drop-down list where you can select the data set you
want to display.
Ï
Plot controls. Controls that let you select plots and turn plots on or off.
Ð
Data set table. Table that shows data sets of lists or points.
Ñ
Point controls. Controls that let you show or hide points.
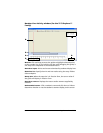
Ò
Graph window panning control. Control that lets you pan the graph
window. There are four controls in the List - Graph tab that let you pan
the graph window up, down, right, and left.
Ò
Ð
Î
ÍÌ
Ï
Ê
Ñ
Ë