


Running interactive activities 131
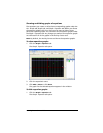
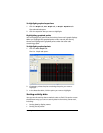
Showing and hiding graphs of equations
The equations you create or collect have corresponding graphs under the
List - Graph tab, Graph tab, and Graph - Equation tab. When you discuss
the equation graphs with your class, you may want to hide or show
particular equation graphs. You can hide or show equation graphs under
the Graph - Equation tab. Any changes you make to the equation graphs
are reflected in all of the graphs in the Activity Center tool.
Note: By default, the Activity Center tool shows the equation graphs.
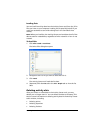
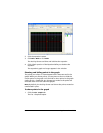
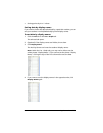
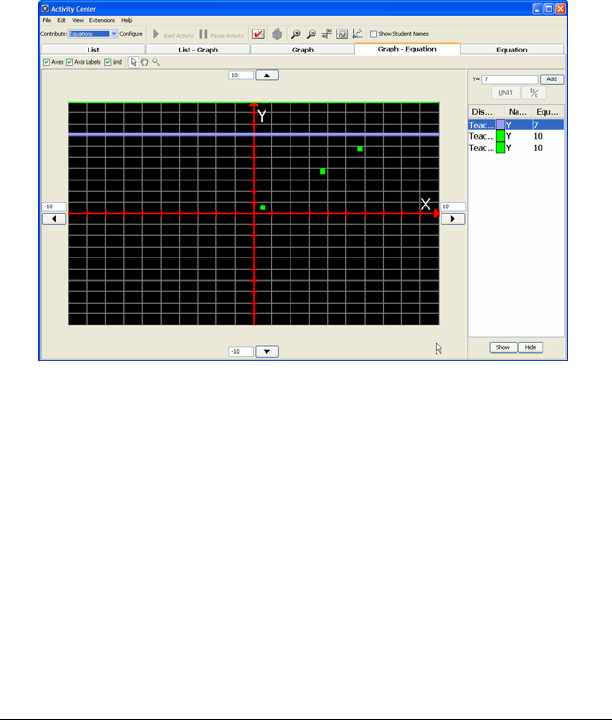
To show equation graphs
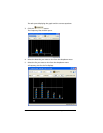
1. Click the Graph - Equation tab.
The Graph - Equation tab opens.
2. Click the equation’s name.
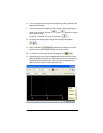
3. Click
Edit > Show or click Show.
The graph for the selected equation appears in the window.
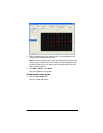
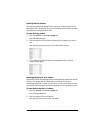
To hide equation graphs
1. Click the Graph - Equation tab.
The Graph - Equation tab opens.