Running interactive activities 85
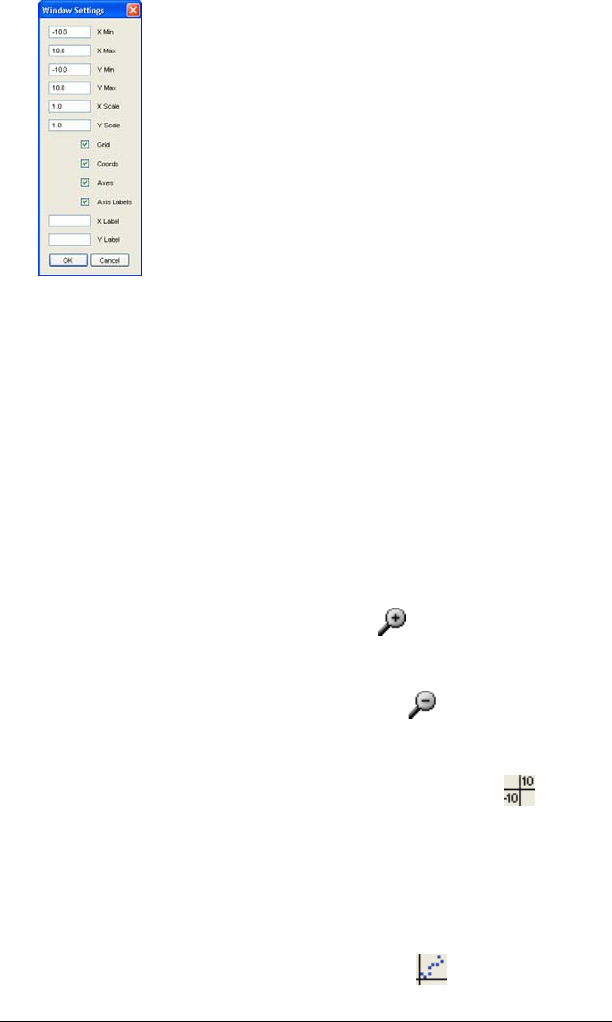
2. Click the X Label box and enter a name for the X axis label.
3. Click the Y Label box and enter a name for the Y axis label.
4. Click
OK.
The labels appear on the graph window.
Zooming in and out on the graph window
On the graph window in the Activity Center tool, you can zoom in, zoom
out, or set the zoom to the standard window range.
Note: You can also zoom to fit data plots (Zoom Stat) or to make the grid
appear square (Zoom Square).
To zoom in on the graph window
f Click
View > Zoom In or click Zoom In .
To zoom out on the graph window
f Click
View > Zoom Out or click Zoom Out .
To zoom to the standard window settings
f Click
View > Zoom Standard or click Zoom Standard .
Zooming to fit data sets (Zoom Stat)
You can use the Zoom Stat option in the Activity Center tool to zoom to
fit all visible data sets.
To zoom to fit data sets
f Click
View > Zoom Stat or click Zoom Stat .
