


Running interactive activities 115
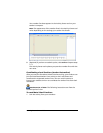
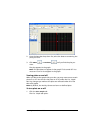
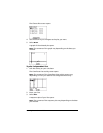
2. From the Data Set drop-down list, select the data set containing the
plots you want.
3. Click
Next or Previous until you find the plot you
want.
The plot appears in the graph.
Note: The plot does not appear in the graph if it is turned off. You
must turn it on for it to appear in the graph.
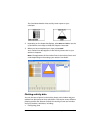
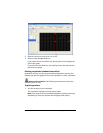
Turning plots on and off
When you discuss the graph with your class, you may want to turn certain
plots on or off. You can turn the plots on or off under the List - Graph
tab. Any changes you make to the plots are reflected under all of the
tabs with graphs.
Note: By default, the Activity Center tool turns on defined plots.
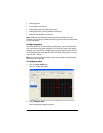
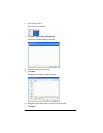
To turn plots on or off
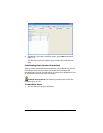
1. Click the List - Graph tab.
The List - Graph tab opens.