


Running interactive activities 79
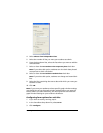
7. If you have chosen a Divided Rectangle, enter a value for height
(1-12).
8. If you have chosen a Divided Circle, enter a value for number of
wedges (max 24).
9. Check whether or not to allow students to resubmit estimates.
10. Click OK to continue.
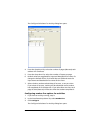
Changing the graph window settings
When you use the graph in the Activity Center tool, you may need to
make the graph window look different from its default appearance.
There are a number of ways you can change the graph window’s
appearance, including:
• Changing the graph window scale
• Changing the X and Y graph window ranges
• Turning graph window attributes on and off
• Creating axis labels
• Zooming in and out on the graph window
• Zooming to fit data sets (Zoom Stat)
• Making the grid of the graph window square (Zoom Square)
• Panning the graph window
• Changing the graphing pen color and width for equations
• Changing the appearance of students’ cursors
• Adding and removing background images for the graph window
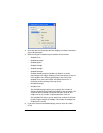
Changing the graph window scale
When necessary, you can change the graph window’s scale. This controls
the spacing of the tic marks on the axes and the spacing of the grid lines.
You can change both the X scale and the Y scale.
Note: By default, both the X and the Y scale are 1.
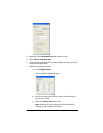
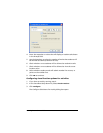
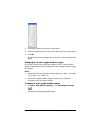
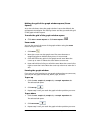
To change the graph window scale
1. Click Edit > Edit Window Settings or click Edit Window Settings
.
The Window Settings dialog box opens.