


134 Running interactive activities
2. Click the point you want to hide.
Note: To select multiple points, press and hold the Ctrl key and click
the points you wish to select. You can also click and drag the cursor
to select all the points in a region. Press and hold the Ctrl key and
click to deselect points.
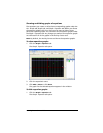
3. Click Edit > Hide or click Hide.
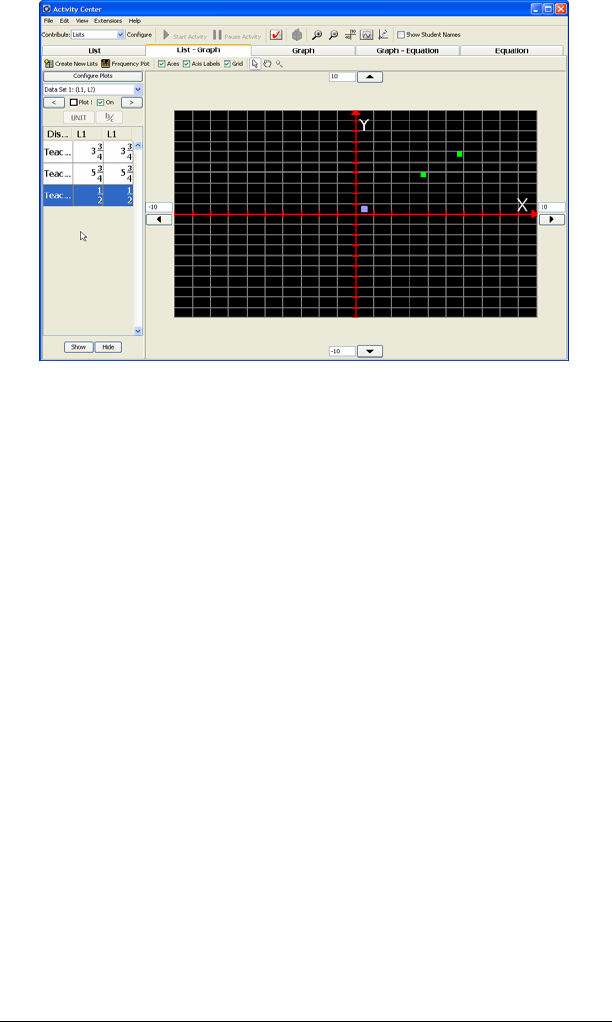
The Activity Center tool dims and italicizes the coordinates of the
point in the data set.
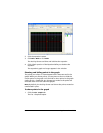
4. Click a blank portion of the Data Set table to deselect the point.
The point no longer appears in the graph.
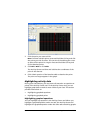
Highlighting activity data
During your class sessions, you may want call attention to equations or
points in the Activity Center tool. In the Activity Center tool, you can
highlight graph data to make it more visible to your class. This section
provides instructions on:
• Highlighting graphed equations
• Highlighting graphed points
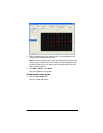
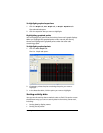
Highlighting graphed equations
You can highlight any equation in the Activity Center tool. When you
highlight a graphed equation under one tab, the Activity Center tool
highlights the graphed equation under the other tabs containing graphs.