


118 Running interactive activities
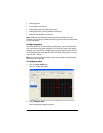
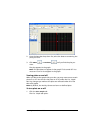
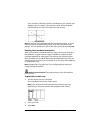
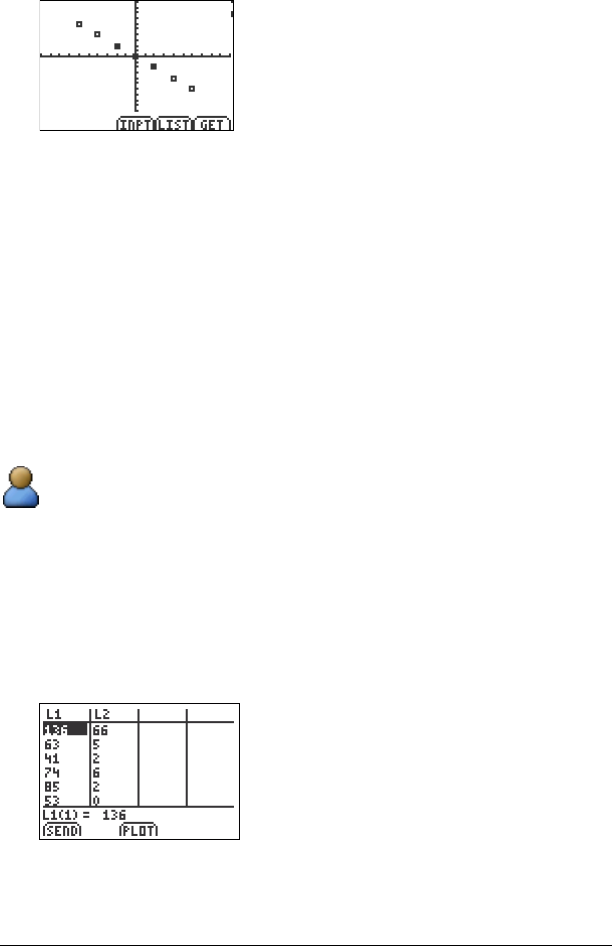
Your calculator collects the points contributed to your teacher and
displays them in a graph. Your points are solid, while the points
contributed by the rest of the class have clear centers.
Note: If you and your classmates are still contributing points, or if you
have the option of resubmitting points, then the class’s points may
change. You can update your plot of the class’s points by selecting Get.
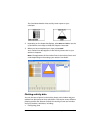
Plotting lists (student instruction)
After your students contribute their lists, they may want to view their
lists plotted in a graph. The plot types available to students on their
calculator depends on what type of list data you are collecting from
them. Students can plot both data sets and independent lists. You can
use this section to instruct your students on how to plot either data sets
or independent lists.
Note: Students can only plot lists if you configured plots when you
configured the list options.
Student Point of View: The steps below are from the student’s
point of view.
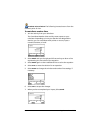
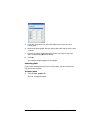
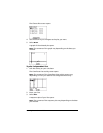
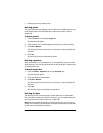
To plot lists in data sets
1. Join the activity on your calculator.
The Contribute Lists activity screen opens.
Note: The contents of the Contribute Lists activity screen vary
depending on how your teacher has configured the activity.
2. Enter your lists.
3. Select
Plot.