


Running interactive activities 129
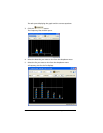
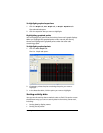
6. You can customize the range of the frequency plot by adjusting the
Begin and End values.
7. You can customize the display of the frequency plot by specifying a
value for the interval. Use the and buttons to create
the fractional value.
To specify an interval of 1/2, you would type 1 2.
8. To change the display, select a style from the Style dropdown.
9. Select or deselect to determine whether or not the
total for each column displays as the top of the column.
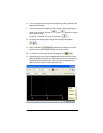
10. To zoom in on the range of points displayed, click .
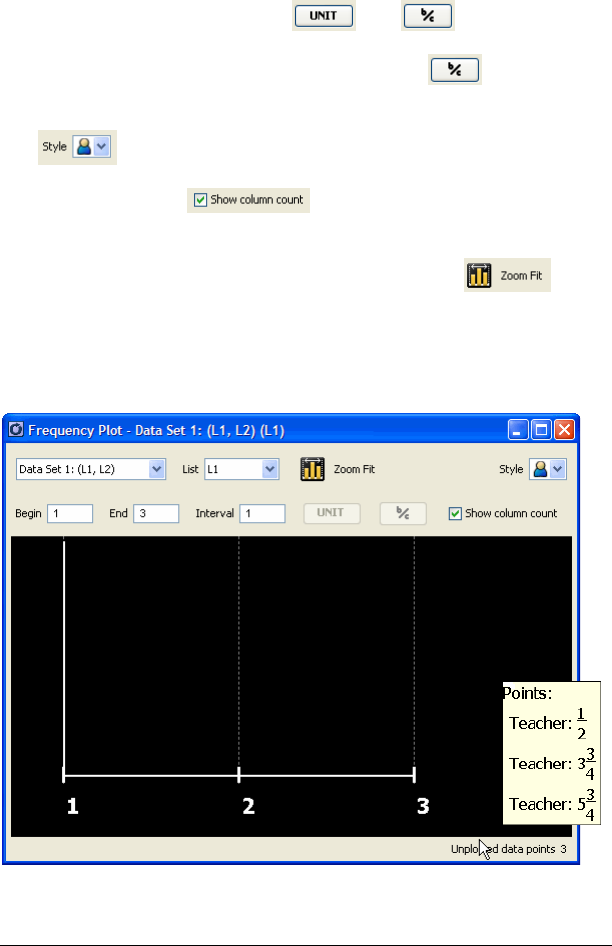
11. Data that does not fit into the Begin/End/Interval format you have
specified displays on the lower right hand corner of the window, as
unplotted points. Position your cursor over the Unplotted Points
label to see the values of the unplotted points.