Previews 127
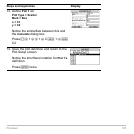
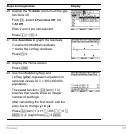
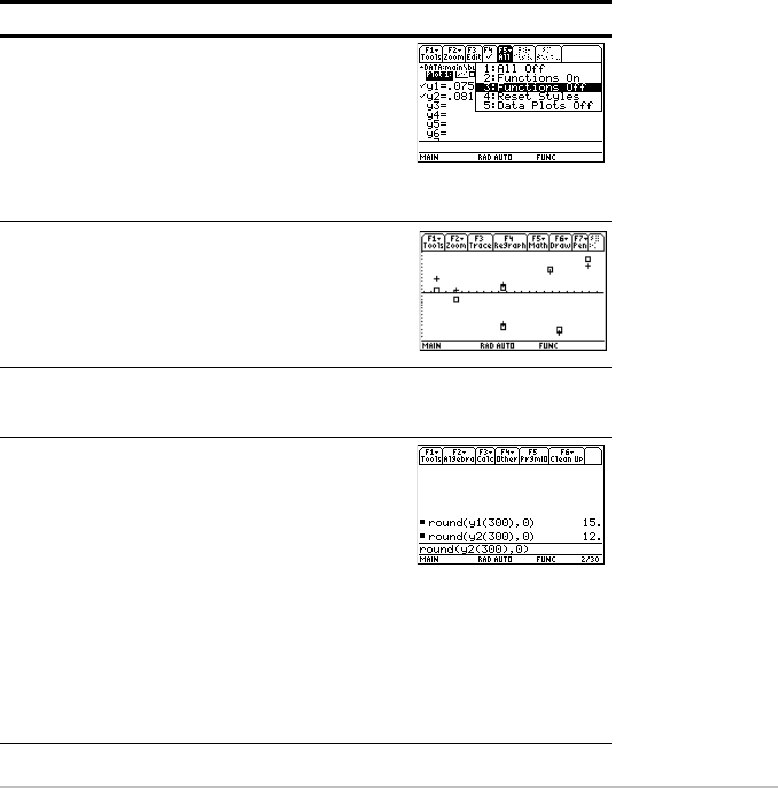
26. Display the Y= Editor and turn all the y(x)
functions off.
From ‡, select
3:Functions Off, not
1:All Off.
Plots 2 and 3 are still selected.
Press 8 # ‡ 3
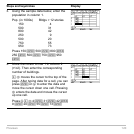
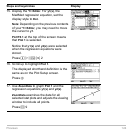
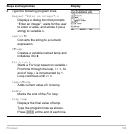
27. Use
ZoomData to graph the residuals.
› marks the MedMed residuals;
+ marks the LinReg residuals.
Press „ 9
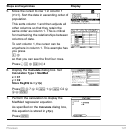
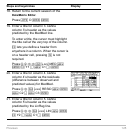
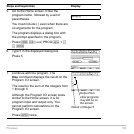
28. Display the Home screen.
Press "
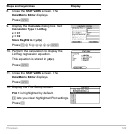
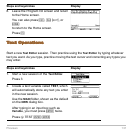
29. Use the MedMed (
y1(x)) and
LinReg (
y2(x)) regression equations to
calculate values for x = 300 (300,000
population).
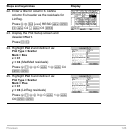
The
round function ( 2I13)
ensures that results show an integer
number of buildings.
After calculating the first result, edit the
entry line to change
y1 to y2.
Press 2 I 1 3 Y1 c 300 d b 0 d
¸ B A (eight times) 0 2 ¸
Steps and keystrokes Display


