Polar Graphing 345
ƒ 9
– or –
8 Í
to set
Coordinates = POLAR. If Coordinates = RECT, the polar equations will be graphed
properly, but coordinates will be displayed as x and y.
When you trace a polar equation, the q coordinate is shown even if
Coordinates = RECT.
Exploring a Graph
Exploring a GraphExploring a Graph
Exploring a Graph
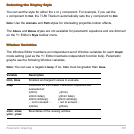
As in function graphing, you can explore a graph by using the following tools. Any
displayed coordinates are shown in polar or rectangular form as set in the graph format.
Tool For Polar Graphs:
Free-Moving
Cursor
Works just as it does for function graphs.
„ Zoom
Works just as it does for function graphs.
•Only x (xmin, xmax, xscl) and y (ymin, ymax, yscl)
Window variables are affected.
• The
q Window variables (qmin, qmax, qstep) are not
affected unless you select
6:ZoomStd (which sets
qmin = 0, qmax = 2p, and qstep = p/24).


