898 Appendix A: Functions and Instructions
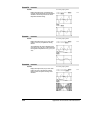
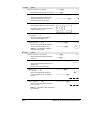
ZoomFit CATALOG
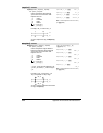
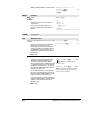
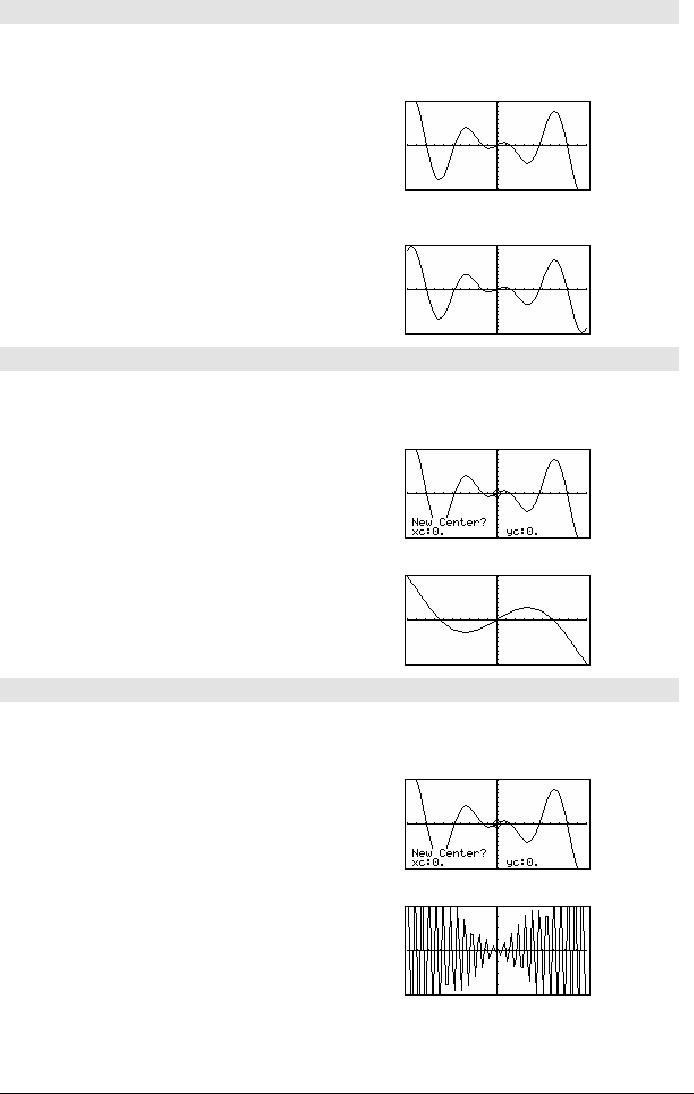
ZoomFit
Displays the Graph screen, and calculates the
necessary window dimensions for the dependent
variables to view all the picture for the current
independent variable settings.
In function graphing mode:
1.25xù cos(x)!y1(x) ¸ Done
ZoomStd
¸
"
ZoomFit
¸
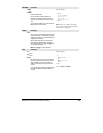
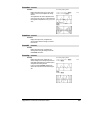
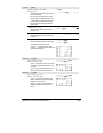
ZoomIn CATALOG
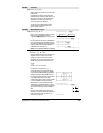
ZoomIn
Displays the Graph screen, lets you set a center
point for a zoom in, and updates the viewing
window.
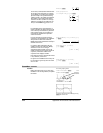
The magnitude of the zoom is dependent on the
Zoom factors xFact and yFact. In 3D Graph mode,
the magnitude is dependent on
xFact, yFact, and
zFact.
In function graphing mode:
1.25xù cos(x)!y1(x) ¸ Done
ZoomStd:ZoomIn
¸
¸
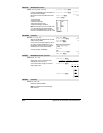
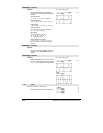
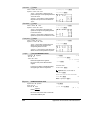
ZoomInt CATALOG
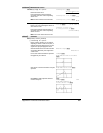
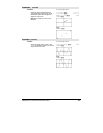
ZoomInt
Displays the Graph screen, lets you set a center
point for the zoom, and adjusts the window
settings so that each pixel is an integer in all
directions.
In function graphing mode:
1.25xù cos(x)!y1(x) ¸ Done
ZoomStd:ZoomInt
¸
¸


