Tables 459
•Set Graph < - > Table and Independent by using the setTable function. Refer to the
Technical Reference module.
Displaying an Automatic Table
Displaying an Automatic TableDisplaying an Automatic Table
Displaying an Automatic Table
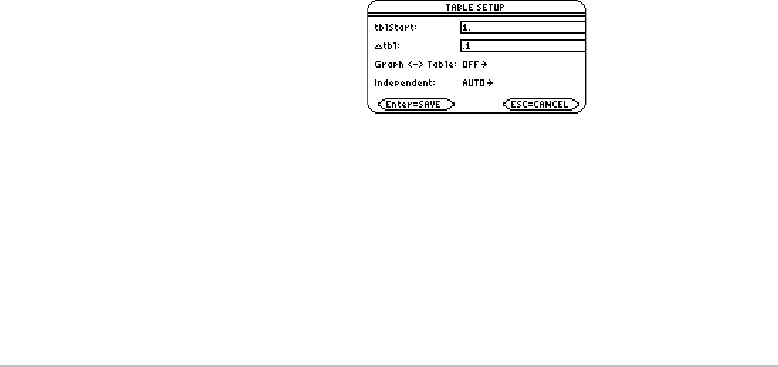
If Independent = AUTO on the TABLE SETUP dialog box, a table is generated
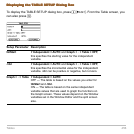
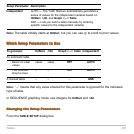
automatically when you display the Table screen. If Graph < - >Table
=ON, the table
matches the trace values from the Graph screen. If Graph < - >Table
=OFF, the table is
based on the values you entered for
tblStart and @tbl.
Before You Begin
Before You BeginBefore You Begin
Before You Begin
Define and select the applicable functions on the Y= Editor (¹#). This example uses
y1(x) = x
3
Nx/3.
Displaying the Table Screen
Displaying the Table ScreenDisplaying the Table Screen
Displaying the Table Screen
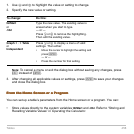
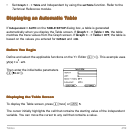
To display the Table screen, press ¹' or O
5.
The cursor initially highlights the cell that contains the starting value of the independent
variable. You can move the cursor to any cell that contains a value.
Then enter the initial table parameters
(¹&).


