


790 Appendix A: Functions and Instructions
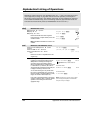
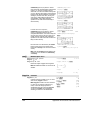
ceiling() MATH/Number menu
ceiling(
expression1
) ⇒
⇒⇒
⇒
integer
Returns the nearest integer that is ‚ the
argument.
The argument can be a real or a complex number.
Note: See also
floor().
ceiling(0.456) ¸ 1.
ceiling(
list1
) ⇒
⇒⇒
⇒
list
ceiling(
matrix1
) ⇒
⇒⇒
⇒
matrix
Returns a list or matrix of the ceiling of each
element.
ceiling({ë3.1,1,2.5}) ¸
{ë3. 1 3.}
ceiling([0,ë3.2i;1.3,4])
¸
[
0
2.
ë3.ø
i
4
]
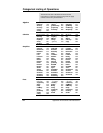
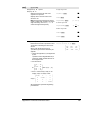
BldData CATALOG
BldData [
dataVar
]
Creates data variable
dataVar
based on the
information used to plot the current graph.
BldData is valid in all graphing modes.
If
dataVar
is omitted, the data is stored in the
system variable
sysData.
Note: The first time you start the Data/Matrix
Editor after using
BldData,
dataVar
or sysData
(depending on the argument you used with
BldData) is set as the current data variable.
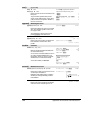
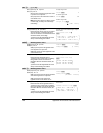
The incremental values used for any independent
variables (
x in the example to the right) are
calculated according to the Window variable
values.
For information about the increments used to
evaluate a graph, refer to the module that
describes that graphing mode.
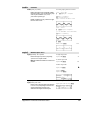
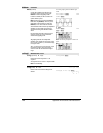
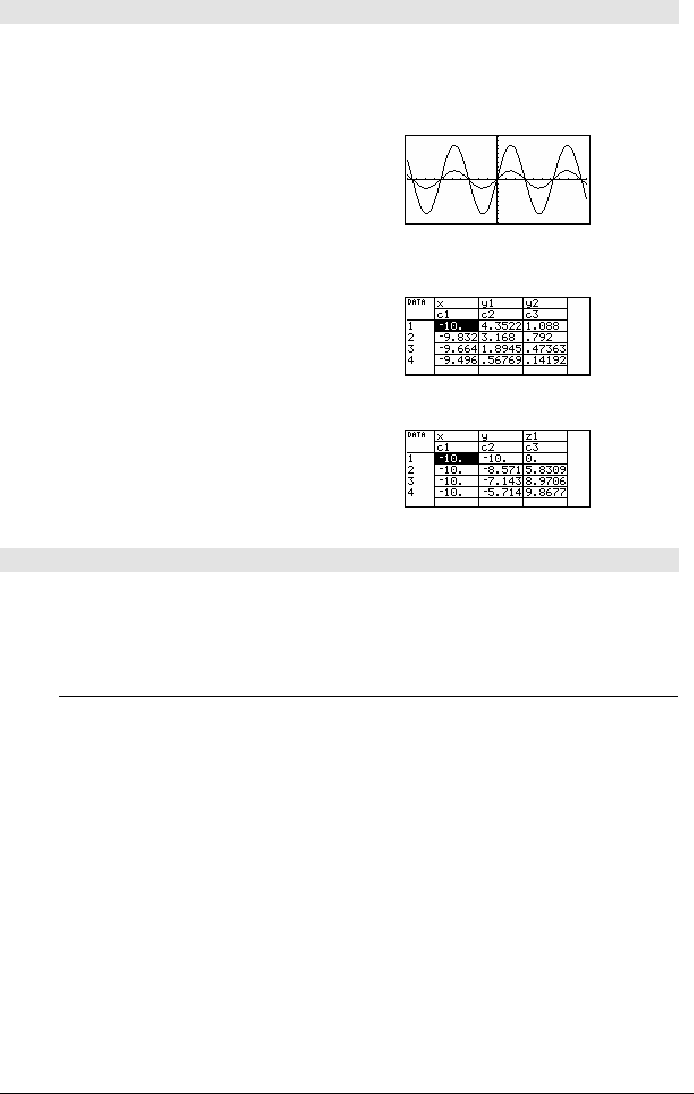
In function graphing mode and Radian angle
mode:
8ùsin(x)!y1(x) ¸ Done
2ùsin(x)!y2(x) ¸ Done
ZoomStd ¸
@ "
BldData ¸ Done
O 6 ¸
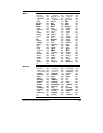
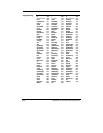
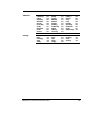
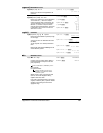
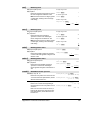
3D graphing mode has two independent
variables. In the sample data to the right, notice
that
x remains constant as y increments through
its range of values.
Then,
x increments to its next value and y again
increments through its range. This pattern
continues until
x has incremented through its
range.
Note: The following sample data is from a 3D
graph.