Statistics and Data Plots 558
Using the Y= Editor with Stat Plots
Using the Y= Editor with Stat PlotsUsing the Y= Editor with Stat Plots
Using the Y= Editor with Stat Plots
The previous sections described how to define and select stat plots from the Data/Matrix
Editor. You can also define and select stat plots from the Y= Editor.
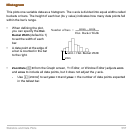
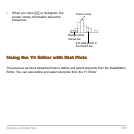
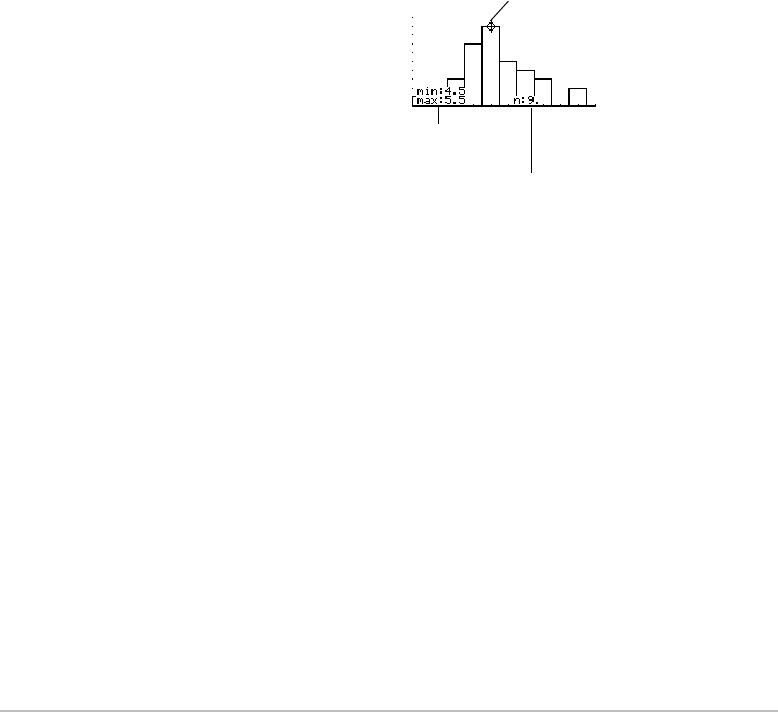
• When you trace (…) a histogram, the
screen shows information about the
traced bar.
Trace cursor
Range of the
traced bar
# of data points in
the traced bar


