Additional Graphing Topics 474
Note: Graph uses the current Window variable settings and is available from the Home
screen’s † toolbar menu.
Graph does not work with sequence graphs or differential equations. For parametric,
polar, and 3D graphs, use the following variations.
Note: To create a table from the Home screen, use the Table command. It is similar to
Graph. Both share the same expressions.
Graph does not copy the expression to the Y= Editor. Instead, it temporarily suspends
any functions selected on the Y= Editor. You can trace, zoom, or show and edit
Graph
expressions on the Table screen, just the same as Y= Editor functions.
Clearing the Graph Screen
Clearing the Graph ScreenClearing the Graph Screen
Clearing the Graph Screen
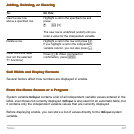
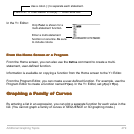
Each time you execute
Graph, the new expression is added to the existing ones. To clear
the graphs:
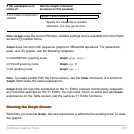
A non-native independent
variable
In PARAMETRIC graphing mode: Graph xExpr, yExpr, t
In POLAR graphing mode:
Graph expr,
q
In 3D graphing mode: Graph expr, x, y
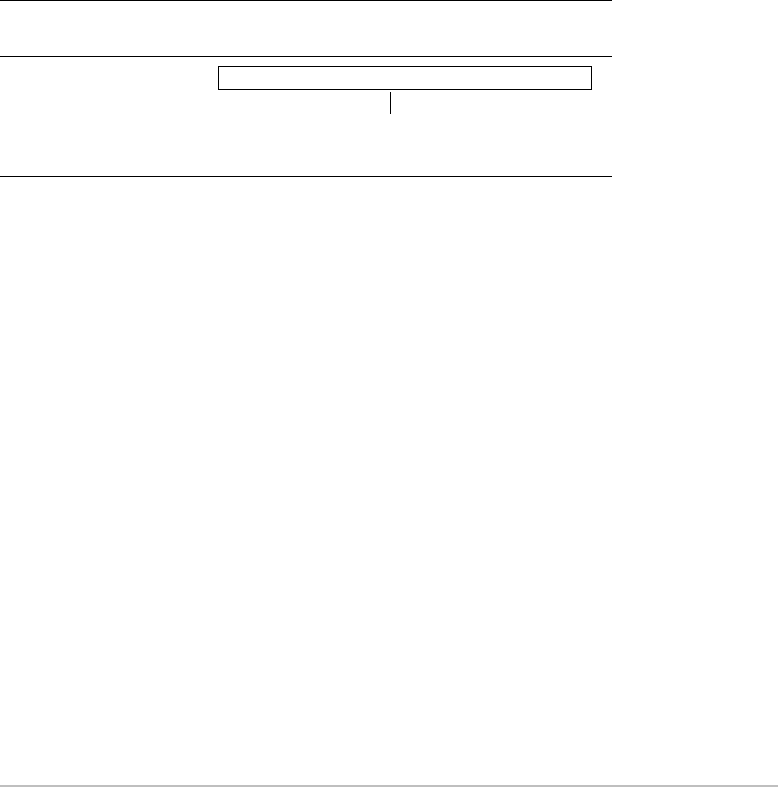
If the expression is in
terms of:
Use the Graph command
as shown in this example:
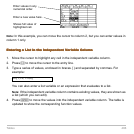
Graph 1.25aùcos(a),a
Specify the independent variable;
otherwise, you may get an error.


