Differential Equation Graphing 435
Note: t is not valid for either Axis when Fields=DIRFLD. If you select t, an Invalid axes
error occurs when graphing.
Example of Time and Custom Axes
Example of Time and Custom AxesExample of Time and Custom Axes
Example of Time and Custom Axes
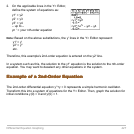
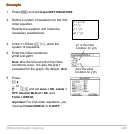
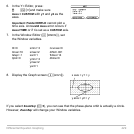
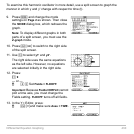
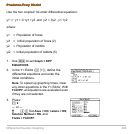
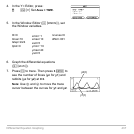
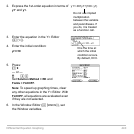
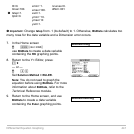
Using the predator-prey model from biology, determine the numbers of rabbits and foxes
that maintain population equilibrium in a certain region. Graph the solution using both
time and custom axes.
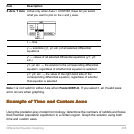
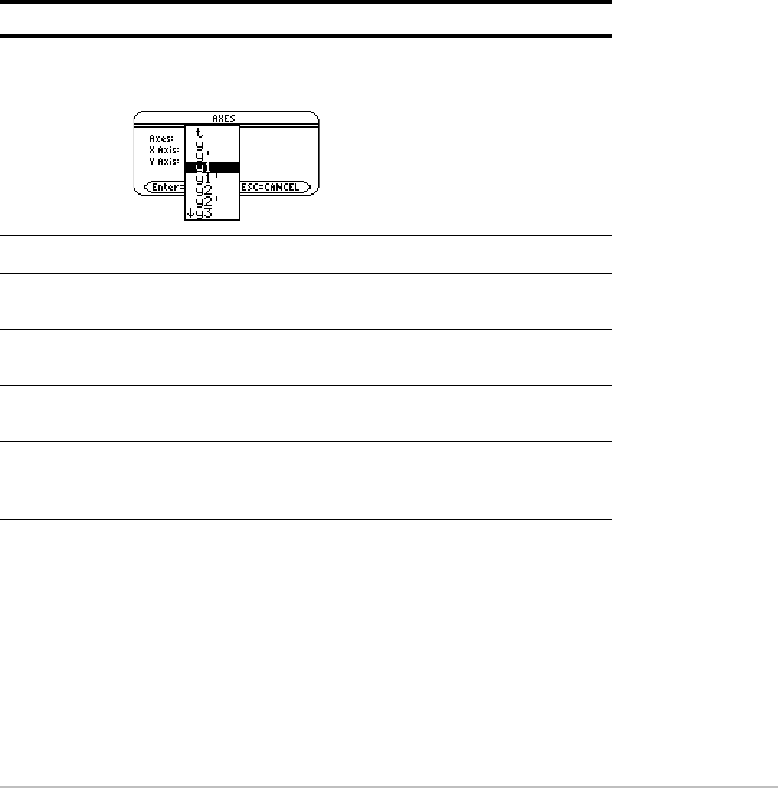
XAxis, YAxis Active only when Axes = CUSTOM, these let you select
what you want to plot on the x and y axes.
t — time
y — solutions (y1, y2, etc.) of all selected differential
equations
y' — values of all selected differential equations (y1', y2',
etc.)
y1, y2, etc. — the solution to the corresponding differential
equation, regardless of whether that equation is selected
y1', y2', etc. — the value of the right-hand side of the
corresponding differential equation, regardless of whether
that equation is selected
Item Description


