836 Appendix A: Functions and Instructions
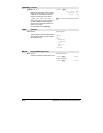
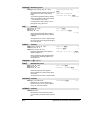
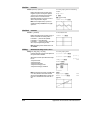
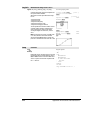
LineTan CATALOG
LineTan
expression1
,
expression2
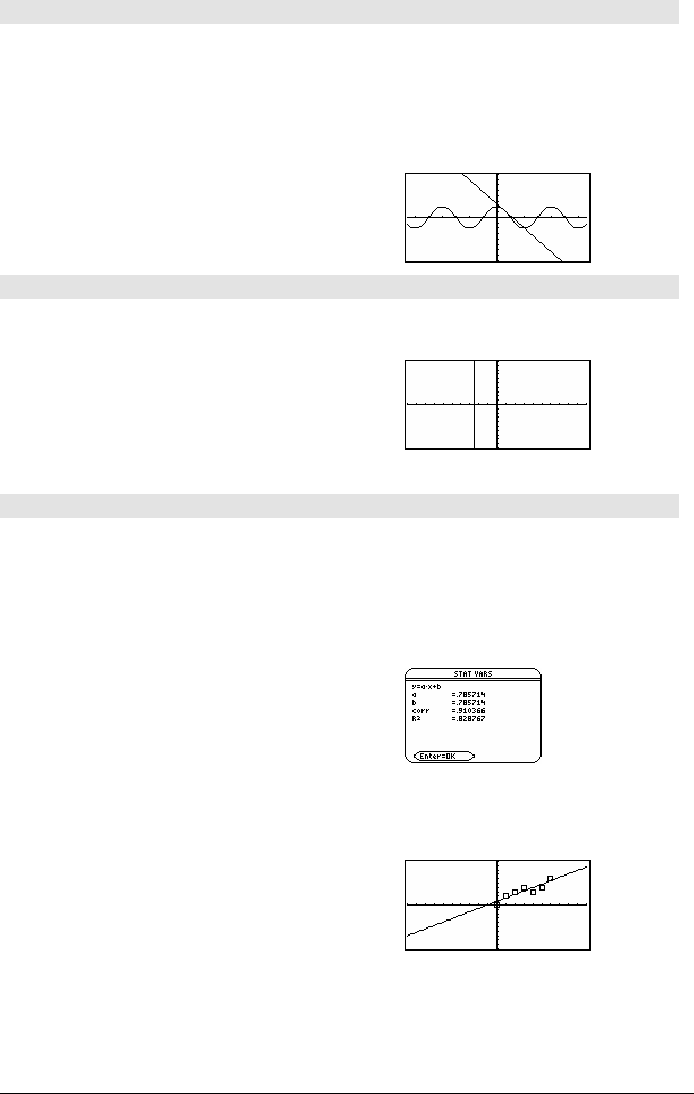
Displays the Graph screen and draws a line
tangent to
expression1
at the point specified.
expression1
is an expression or the name of a
function, where
x is assumed to be the
independent variable, and
expression2
is the x
value of the point that is tangent.
Note: In the example shown,
expression1
is
graphed separately.
LineTan does not graph
expression1.
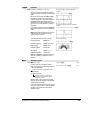
In function graphing mode and a
ZoomTrig
window:
Graph cos(x)
@ "
H ¥"
LineTan cos(x),p/4 ¸
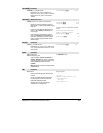
LineVert CATALOG
LineVert
x
[,
drawMode
]
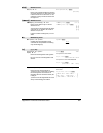
Displays the Graph screen and draws, erases, or
inverts a vertical line at window position
x
.
If
drawMode
= 1, draws the line (default).
If
drawMode
= 0, turns off the line.
If
drawMode
= ë1, turns a line that is on to off or
off to on (inverts pixels along the line).
Note: Regraphing erases all drawn items. See
also
PxlVert.
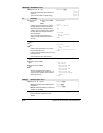
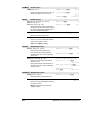
In a
ZoomStd window:
LineVert ë 2.5 ¸
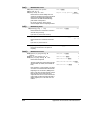
LinReg MATH/Statistics/Regressions menu
LinReg
list1
,
list2
[, [
list3
] [,
list4
,
list5
]]
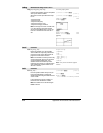
Calculates the linear regression and updates all
the system statistics variables.
All the lists must have equal dimensions except
for
list5
.
list1
represents xlist.
list2
represents ylist.
list3
represents frequency.
list4
represents category codes.
list5
represents category include list.
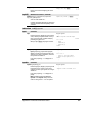
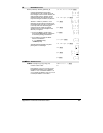
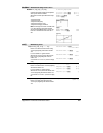
In function graphing mode:
{0,1,2,3,4,5,6}! L1 ¸
{0 1 2 ...}
{0,2,3,4,3,4,6}! L2 ¸
{0 2 3 ...}
LinReg L1,L2 ¸ Done
ShowStat
¸
Note:
list1
through
list4
must be a variable name
or c1–c99 (columns in the last data variable
shown in the Data/Matrix Editor).
list5
does not
have to be a variable name and cannot be c1–
c99.
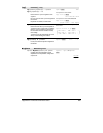
¸
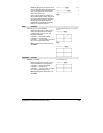
Regeq(x)"y1(x) ¸ Done
NewPlot 1,1,L1,L2
¸ Done
¥%


