Chapter 10 Monitor
ZyWALL USG 300 User’s Guide
255
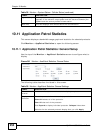
10.11.2 Application Patrol Statistics: Bandwidth Statistics
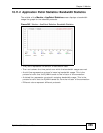
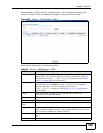
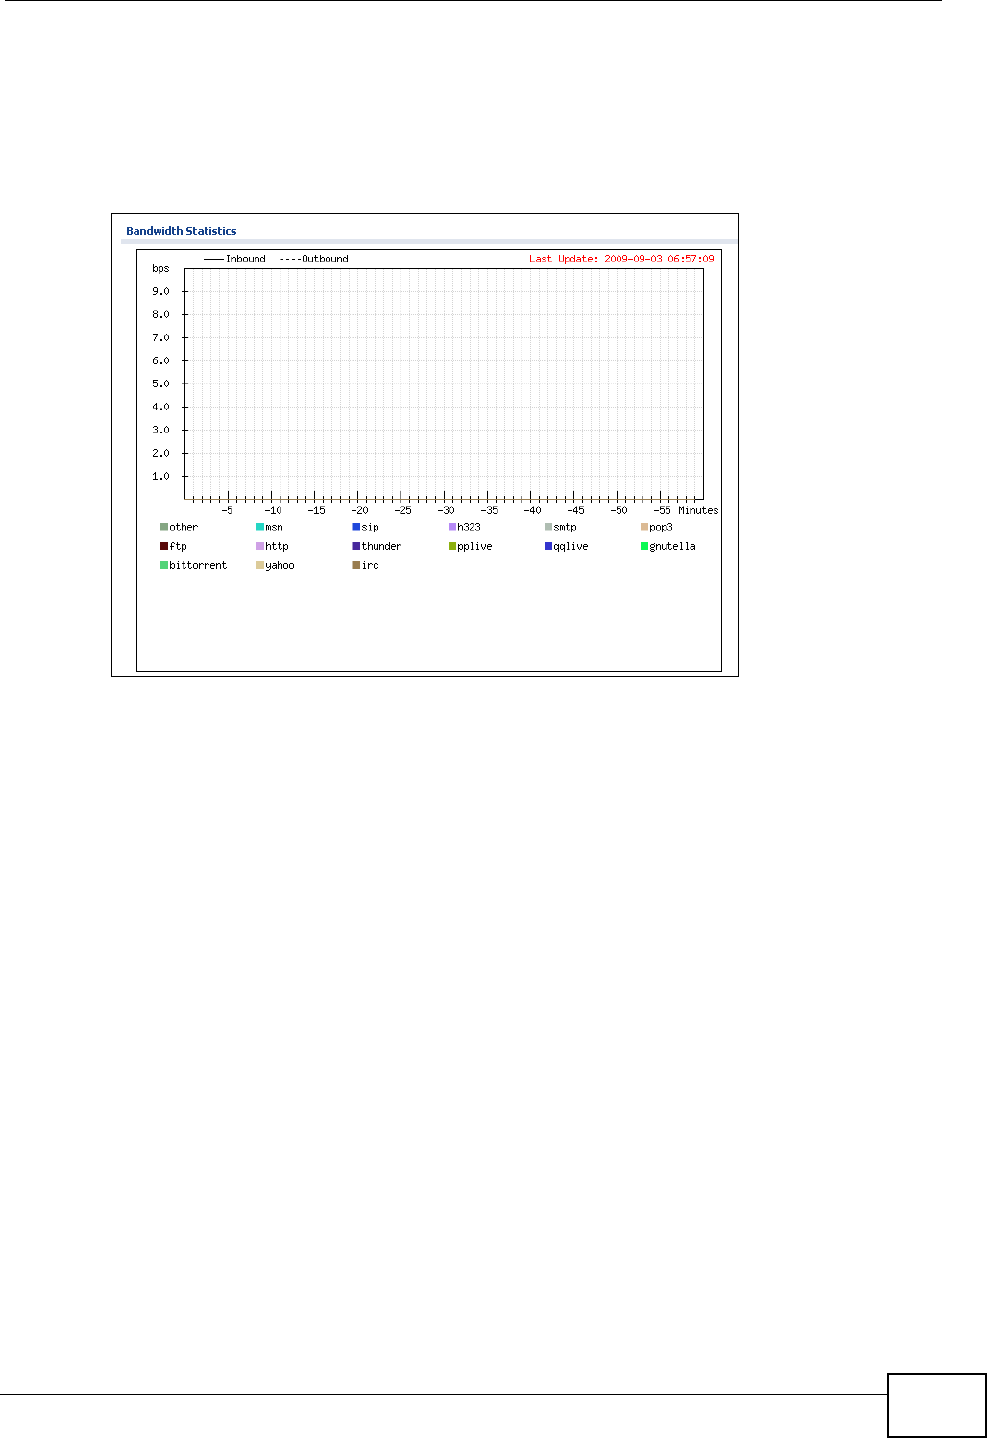
The middle of the Monitor > AppPatrol Statistics screen displays a bandwidth
usage line graph for the selected protocols.
Figure 242 Monitor > AppPatrol Statistics: Bandwidth Statistics
• The y-axis represents the amount of bandwidth used.
• The x-axis shows the time period over which the bandwidth usage occurred.
• A solid line represents a protocol’s incoming bandwidth usage. This is the
protocol’s traffic that the ZyWALL sends to the initiator of the connection.
• A dotted line represents a protocol’s outgoing bandwidth usage. This is the
protocol’s traffic that the ZyWALL sends out from the initiator of the connection.
• Different colors represent different protocols.


