Remote Monitoring (RMON) Diagnosing Switch Problems
page 27-30 OmniSwitch 6600 Family Network Configuration Guide April 2006
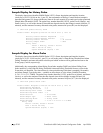
Sample Display for History Probe
The display shown here identifies RMON Probe 10325’s Owner description and interface location
(Analyzer-p:128.251.18.166 on slot 1, port 35), the total number of History Control Buckets (samples)
requested and granted (2), along with the time interval for each sample (30 seconds) and system-generated
Sample Index ID number (5859). The probe Entry number identifier (10325), probe Flavor (History), and
Status (Active), as well as the amount of time that has elapsed since the last change in status (48 hours, 53
minutes), and the amount of memory allocated to the probe, measured in bytes (601) are also displayed.
-> show rmon probes history 30562
Probe’s Owner: Analyzer-p:128.251.18.166 on Slot 1, Port 35
History Control Buckets Requested = 2
History Control Buckets Granted = 2
History Control Interval = 30 seconds
History Sample Index = 5859
Entry 10325
Flavor = History, Status = Active
Time = 48 hrs 53 mins,
System Resources (bytes) = 601
Sample Display for Alarm Probe
The display shown here identifies RMON Probe 11235’s Owner description and interface location
(Analyzer-t:128.251.18.166 on slot 1, port 35), as well as the probe’s Alarm Rising Threshold and Alarm
Falling Threshold, maximum allowable values beyond which an alarm will be generated and sent to the
Event group (5 and 0, respectively).
Additionally, the corresponding Alarm Rising Event Index number (26020) and Alarm Falling Event
Index number (0), which link the Rising Threshold Alarm and Falling Threshold Alarm to events in the
Event table, are identified. The Alarm Interval, a time period during which data is sampled (10 seconds)
and Alarm Sample Type (delta value—variable) are also shown, as is the Alarm Variable ID number
(1.3.6.1.2.1.16.1.1.1.5.4008). The probe Entry number identifier (11235), probe Flavor (Alarm), and Status
(Active), as well as the amount of time that has elapsed since the last change in status (48 hours, 48
minutes), and the amount of memory allocated to the probe, measured in bytes (1677) are also displayed.
-> show rmon probes alarm 31927
Probe’s Owner: Analyzer-t:128.251.18.166 on Slot 1, Port 35
Alarm Rising Threshold = 5
Alarm Falling Threshold = 0
Alarm Rising Event Index = 26020
Alarm Falling Event Index = 0
Alarm Interval = 10 seconds
Alarm Sample Type = delta value
Alarm Startup Alarm = rising alarm
Alarm Variable = 1.3.6.1.2.1.16.1.1.1.5.4008
Entry 11235
Flavor = Alarm, Status = Active
Time = 48 hrs 48 mins,
System Resources (bytes) = 1677


