


Alpha 21264/EV67 Hardware Reference Manual
Privileged Architecture Library Code 6–17
Performance Counter Support
srl r4, #OSF_PTE__PFN__S, r6 ; (xU) shift PFN to <0>
sll r6, #EV6__ITB_PTE__PFN__S, r6 ; (xU) shift PFN into place
and r4, #<1@OSF_PTE__FOE__S>, r7 ; (xL) get FOE bit
blbc r4, trap__invalid_ipte ; (xU) invalid => branch
bne r7, trap__foe ; (xU) FOE => branch
srl r4, #7, r7 ; check for mb bit
bis r5, r6, r6 ; (xL) PTE in ITB format
hw_mtpr r23, EV6__ITB_TAG ; (6,0L) write tag
hw_mtpr r6, EV6__ITB_PTE ; (0&4,0L) write PTE
ASSUME <tb_mb_en + pte_eco> ne 2
.if ne pte_eco
blbc r7, trap__itb_miss_mb ; branch for mb
hw_ret_stall (r23); (0L)
trap__itb_miss_mb:
mb
.endc
hw_ret_stall (r23) ; (0L)
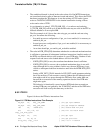
The following list presents information about the ITB miss flow code example:
• In Figure 6–6, where (x,y) or (y) appear in the comments, x specifies the scoreboard
bits and y specifies the Ebox subcluster.
• The ITB is only accessed on Icache misses.
• r4 −r7 and r20 − r23 are PALshadow registers.
• PALshadow r22 contains a flag that indicates whether the native code is running
“1−to−1”, that is, running in a mode where the physical address should be mapped
1−to−1 to the virtual address, rather than being taken from a page table.
• The HW_RET instruction should have its STALL bit set to ensure that the restarted
Istream does not read the ITB until the ITB is written.
As an alternative to using I_CTL[TB_MB_EN] = 1 to enforce read ordering,
I_CTL[TB_MB_EN] can be set to 0 and the PALcode may use a bit in the PTE to
indicate whether to do an explicit MB. The flow example in Figure 6–6 assumes
this alternative.
6.10 Performance Counter Support
The 21264/EV67 provides hardware support for two methods of obtaining program
performance feedback information. The two methods do not require program modifica-
tion. Instead, performance monitoring utilities make calls to the PALcode to set up the
counters and contain interrupt handlers that call PALcode to retrieve the collected data.
The first method, Aggregate mode, offers capabilities that are similar to earlier micro-
processor performance counters. This mode counts events when enabled, until it over-
flows, causing an interrupt that can retrieve the collected data. The second method,