


Alpha 21264/EV67 Hardware Reference Manual
Privileged Architecture Library Code 6–23
Performance Counter Support
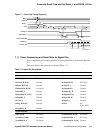
6.10.3.3 ProfileMe Counting Mode Description
6.10.3.3.1 Cycle counting
In ProfileMe mode, either counter counts cycles during the window of the profiled
instruction.
6.10.3.3.2 Inum retire delay cycles
This input is used to measure a lower bound on the inum retire delay of the profiled
instruction. The maximum final value of PCTR1 is the length of the ProfileMe window
minus 2.
Counts cycles that a profiled instruction delayed the retire pointer advance during the
ProfileMe window. The 21264/EV67 tracks instructions in the pipeline by allocating
them "inums" near the front of the pipeline. All inums are retired in the order in which
they were allocated at the end of the pipeline.
Inums are allocated in batches of four, so there may be more inums allocated than there
are program instructions in flight. Every inum is retired in order, including those for
aborted instructions.
The "retire pointer" points to the next inum to be retired. An inum retires in the cycle
that the retire pointer advances past the inum.
Let X and Y be consecutive inums in the allocation order. The "inum retire delay" of Y
is [(cycle in which Y retired) – (cycle in which X retired)]. A large inum retire delay
indicates a possible performance bottleneck (for example, an instruction stalled on a
data cache miss).
6.10.3.3.3 Retired instructions cycles
When counting retired instructions in ProfileMe mode, the final count in PCTR0 may
include instructions that retired before the ProfileMe window and may exclude instruc-
tions that retired near the end of the ProfileMe window. These discrepancies are caused
by a variable delay between the time that an instruction retires and the time that PCTR0
is incremented for that retire. This discrepancy is in the range of plus or minus 4 retired
instructions.
6.10.3.3.4 Bcache miss or long latency probes cycles
This input counts the number of times the Bcache result was a miss.
Essentially, a long latency probe is a data request from other processes that cause
Bcache misses in a system.
This count is phase shifted three cycles early and thus includes events that occurred
three cycles before the start and before the end of the ProfileMe window.
6.10.3.3.5 Mbox replay traps cycles
This input counts Mbox replay traps.
PCTR1 is enabled to count Mbox replay traps that occur during a window that is the
ProfileMe window phase-shifted one cycle later. The first replay trap counted would be
the 7th cycle after the instruction is fetched.