


Brocade Network Advisor IP User Manual 995
53-1003056-01
IP historical performance monitoring
33
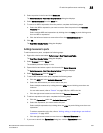
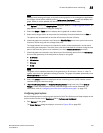
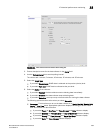
1. Right-click the graph and select Print.
The Page Setup dialog box displays.
2. Edit the paper, orientation, and margins, as needed.
3. Click Printer to select a printer.
4. Click OK.
IP historical performance monitoring
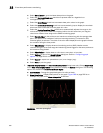
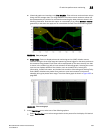
Historical performance monitoring allows you create data collectors by choosing MIB object and by
choosing or creating mathematical expressions. You can also configure a historical data graph or
table to display data. The following options and features are available for obtaining historical
performance data:
• Define a data collector by mapping a MIB (Management Information Base) object to a unit
name (refer to “MIB data collectors” on page 1013).
• Specify and adjust threshold values and polling intervals, and set time schedules for data
collection. Historical data is recorded in a database for retrieval in the form of graphs and
tables.
• Store records for each port.
• Create a custom graph or table display for data by defining options such as the following:
- Selecting a product for displaying data.
- Selecting measures to collect.
- Modifying collectors.
- Plotting minimum and maximum values.
- Displaying data points or polling intervals.
- Displaying events.
- Selecting a graph or table format.
- Enabling granularity of data to display:
5 minutes granularity for last 8 days
30 minutes granularity for last 14 days
2 hour granularity for last 30 days
1 day granularity for last 730 days
- Displaying advanced monitoring service (AMS) violation events.
- Providing a period for plotting the graph or table.
Related topics
“Editing system collectors”
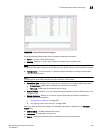
“Displaying historical data collectors”
“Enabling a historical data collector”
“Adding or editing a historical data collector”
“”