


Brocade Network Advisor IP User Manual 269
53-1003056-01
User-defined performance monitors
7
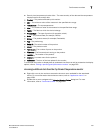
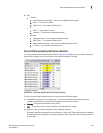
Accessing additional data from the Distribution monitors
• Place the cursor on a bar in the graph to display the number of products included in the count
for the selected bar. For example, the tooltip “(Data Item 3, 22.6-33.8) = 6” means that there
are six products within the third percentage range (displays the temperatures within the
percentage range) for the selected measure (product temperature).
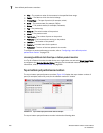
• Double-click a percentage range to navigate to the Monitor_Title Distribution Data Details
dialog box. for more information, refer to “Viewing product distribution data details” on
page 276 or “Viewing port distribution data details” on page 277.
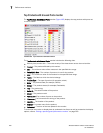
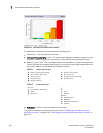
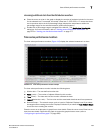
Time series performance monitors
The time series performance monitors (Figure 113) display the selected measures in a chart.
FIGURE 113 Time series performance monitor example
The time series performance monitor includes the following data:
• Monitor title — The user-defined monitor title.
• Value (y-axis) — The number of objects affected by this monitor.
• Time (x-axis) — The date and time the monitor collected the data.
• Legend (below the x-axis) — The line color and the associated data that each line represents.
• Network Scope — The network scope, such as Local or Published. Displays Local if you select
the targets when creating the monitor. Displays Published if you select the Use Network Scope
check box when creating the monitor.
Place the cursor on a data point in graph line to view details. Place the cursor on an Event icon to
view the event details. Right-click the graph to access the graph shortcut menu (refer to
“Configuring the performance graph” on page 989).