


Brocade Network Advisor IP User Manual 287
53-1003056-01
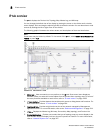
IP tab overview
8
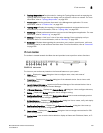
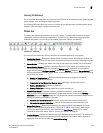
Master Log
The Master Log, which displays in the lower area of the main window, lists the events and alerts
that have occurred on the Network. If you do not see the Master Log, select View > Show Panels >
All Panels or press F5.
The default order of the Master Log columns is ‘Severity’, ‘Acknowledged’, ‘Last Event Server Time’,
and ‘Description’. Which columns are displayed and in what order can be controlled through the
“Customize Columns” dialog, as described in “Displaying columns” and in “Changing the order of
columns”. You can sort the Master Log by clicking a column heading. By default, the Master Log is
sorted by the Last Event Server Time column. To filter information in the Master Log, refer to
“Filtering events in the Master Log” on page 1210. To view event properties, refer to “Displaying
event properties from the Master Log” on page 1207.
The following fields and columns are included in the Master Log:
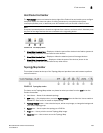
• Severity — The severity of the event. When the same event (Warning or Error) occurs
repeatedly, the Management application automatically eliminates the additional occurrences.
For more information about events, refer to “Fault Management” on page 1141. For a list of
the event icons, refer to “Event icons” on page 292.
• Acknowledged — Whether the event is acknowledged or not. Select the check box to
acknowledge the event.
• Source Name — The product on which the event occurred.
• Source Address — The IP address (IPv4 or IPv6 format) of the product on which the event
occurred.
• Origin — The event source type (for example trap, pseudo event, application, or syslog).
• Category — The type of event that occurred (for example, client/server communication events).
• Description — A description of the event.
• Last Event Server Time — The time and date the event last occurred on the server.
• Count — The number of times the event occurred.
• Module Name — The name of the module on which the event occurred.
• Message ID — The message ID of the event.
• Product Address — The IP address of the product on which the event originated.
• Contributor — The name of the contributor on which the event occurred.
• Node WWN — The world wide name of the node on which the event occurred.
• Fabric Name — The name of the fabric on which the event occurred.
• Operational Status — The operational status (such as, unknown, healthy, marginal, or down) of
the product on which the event occurred.
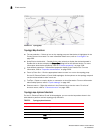
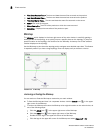
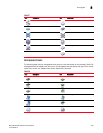
Control + , Launch the Topology Display dialog box.
Right Arrow Move the selection to the node on the right (if available).
Left Arrow Move the selection to the node on the left (if available).
Up Arrow Move the selection to the node above the current selection (if available).
Down Arrow Move the selection to the node that is below the current selection (if available).
TABLE 26 Topology keyboard shortcuts
Keyboard Shortcut Description