


258 Brocade Network Advisor IP User Manual
53-1003056-01
Performance monitors
7
• Contact — A contact name for the product.
• Refreshed — The time of the last update for the monitor.
To customize the monitor to display data by a selected time frame as well as customize the display
options, refer to “Editing a preconfigured performance monitor” on page 263.
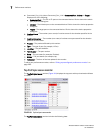
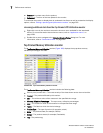
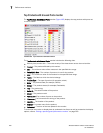
Accessing additional data from the Top Product CPU Utilization monitor
• Right-click a row in the monitor to access the shortcut menu available for the associated
device. For more information about shortcut menus, refer to “Application menus” on
page 1261.
• Double-click a row to navigate to the Historical Graphs/Tables dialog box. For more
information, refer to “Performance Data” on page 969.
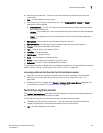
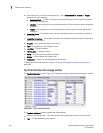
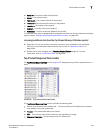
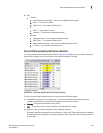
Top Product Memory Utilization monitor
The Top Product Memory Utilization monitor (Figure 106) displays the top product memory
utilization percentages in a table.
FIGURE 106 Top Product Memory Utilization monitor
The Top Product Memory Utilization monitor includes the following data:
• Severity icon/monitor title — The worst severity of the data shown next to the monitor title.
• Product — The product affected by this monitor.
• Min — The minimum value of the measure in the specified time range.
• Memory Utilization Percentage — The top memory utilization percentages.
• Max — The maximum value of the measure in the specified time range.
• Fabric — The fabric to which the device belongs.
• Product Type — The type of product (for example, switch).
• State — The product state (for example, Offline).
• Status — The product status (for example, Reachable).
• Tag — The product tag.